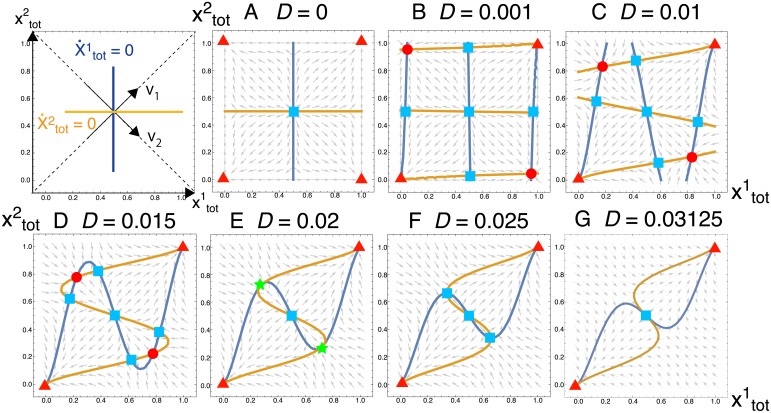
Fig 5. Flow diagram of Eq (10).
As schematically indicated in the left-top panel, the nullclines are shown for and in blue and orange, respectively, and the crossing points of them are solutions. The directions of v1 = (1, 1) and v2 = (1, −1) are also indicated. For the solutions, stable fixed points are shown in red: those with stable growth [i.e., both fragments are in each subsystem] are in red circles, and those without growth [either of fragments is lost from subsystems or whole systems] are in red triangles. Unstable solutions are in light-blue squares, and neutral solutions in the v1-direction are in green stars at D = 0.02 (E). For D = 0 (A), the solution exists at but it is unstable. For small values of D (B to D), the stable fixed points with growth [red circles] appear in addition to fixed points without growth. At D = 0.02 (E), the fixed points with growth get unstable [shown in green stars] in v1-directions. As D increases further (F), the two fixed points are still stable in v2-directions, while the solution at is unstable in the direction. At D = 0.03125 (G), the system transits from the three fixed points to one fixed point.

