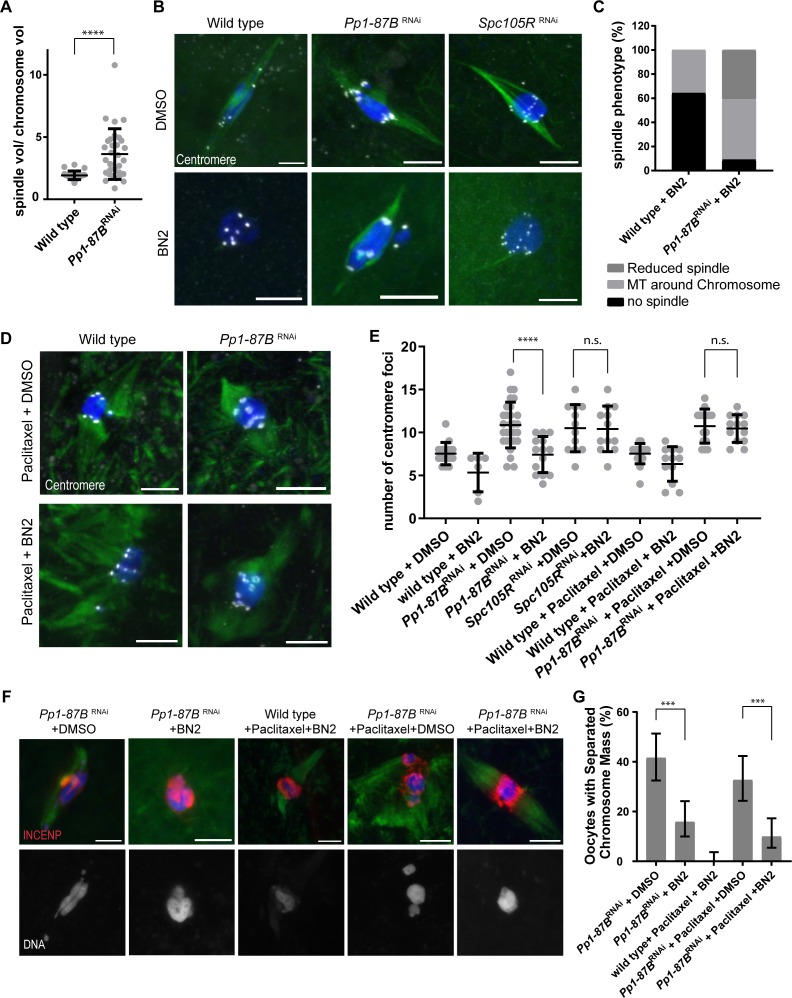
Fig 4. PP1-87B regulation of sister centromere fusion depends on microtubules.
(A) Graph showing the spindle volume relative to the chromosome mass volume. The chromosome mass volumes remain constant while Pp1-87B RNAi oocytes (n = 31) had increased spindle volume compared to wild type (n = 22) oocytes. **** = p <0.0001 (B) Wild-type, Pp1-87B RNAi and Spc105R RNAi oocytes treated with 50μM BN2 or the solvent for one hour. All images are shown with DNA (blue), tubulin (green) and centromeres (white), and the scale bars are 5 μm. (C) Quantification of spindle phenotype in wild-type (n = 28) and Pp1-87B RNAi (n = 22) oocytes after one hour of BN2 treatment. (D) Wild type and Pp1-87B RNAi oocytes treated with Paclitaxel for 10 minutes followed by either BN2 or DMSO for one hour. Centromeres are marked in white. Scale bars are 5 μm. (E) Quantification of centromere foci in indicated genotypes of oocytes (n = 15, 6, 29, 14, 12, 12, 17, 12, 15 and 13 in the order of the graph). Error bars show standard deviation and **** = p<0.0001. (F) Chromosome mass organization in Pp1-87B RNAi oocytes treated for 10 minutes in Paclitaxel followed by BN2 or DMSO for 30 minutes. INCENP localization is shown in red, DNA in blue and tubulin in green. The single channel of DNA is also shown. Scale bar = 5 μm. (G) Quantification from the same experiment in (F). Error bars indicate 95% confidence intervals and *** = p<0.001. The numbers of oocytes were 143,151, 21, 27, 111 in order of the graph.

