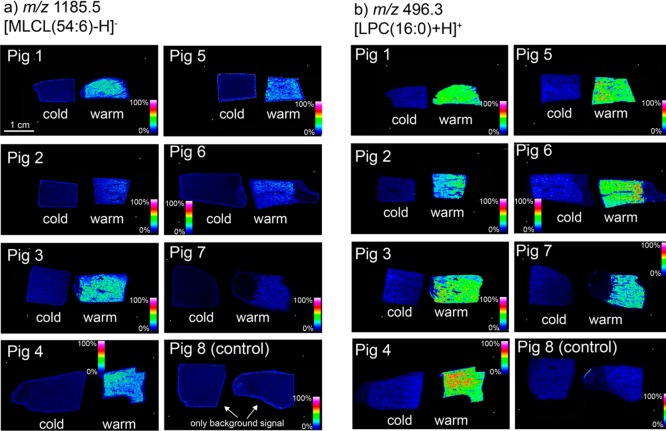
Figure 2.
MS images of discriminatory lipids: mass-spectrometry-imaging data acquired at 50 μm resolution revealing spatial distributions of the lysolipids (a) [MLCL(54:6)–H]− and (b) [LPC(16:0)+H]+ through all 16 tissues (7 warm ischemia, 7 cold ischemia, and 2 control). All images are normalized to the total ion count.

