Figure 3.

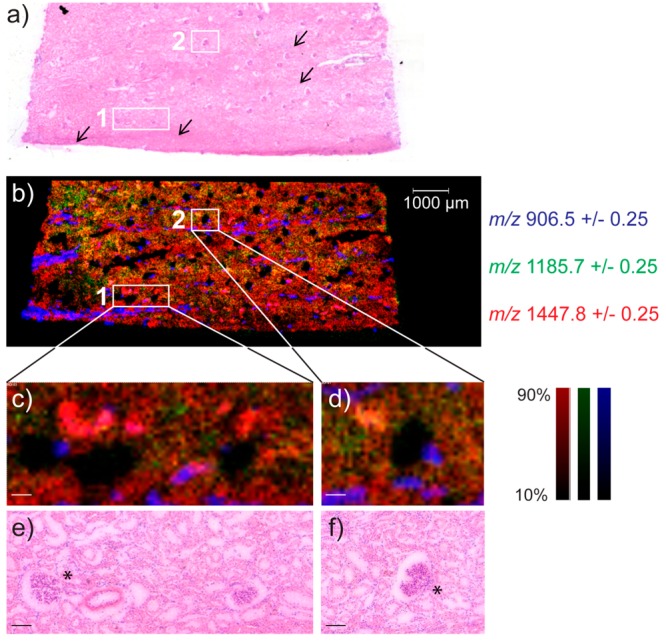
Lipid degradation and distribution in renal tissue after warm-ischemic injury. The post-MSI H&E-stained tissue (a,e,f) was used to generate the MSI data (b–d). (b) Mass-spectrometry-imaging data acquired at 20 μm resolution revealing spatial distributions of [ST(d42:1(2OH))–H]− (m/z 906.5, blue), [MLCL(54:6)–H]− (m/z 1185.7, green), and [CL(72:8)–H]− (m/z 1447.8, red). (c,d) Two regions of interest, marked as (c) 1 and (d) 2, enlarged to show the heterogeneous MLCL(54:6) distribution, relative to that of its main expected precursor, CL(72:8), in distinct tubular cortical areas. All images are normalized to the total ion count. Medullary rays are indicated with black arrows in (a). Asterisks (*) in (e) and (f) indicate juxtaglomerular areas.
