
Fig 2. NMDS and LEfSe analysis of intestinal microbiota composition after antibiotics treatment.
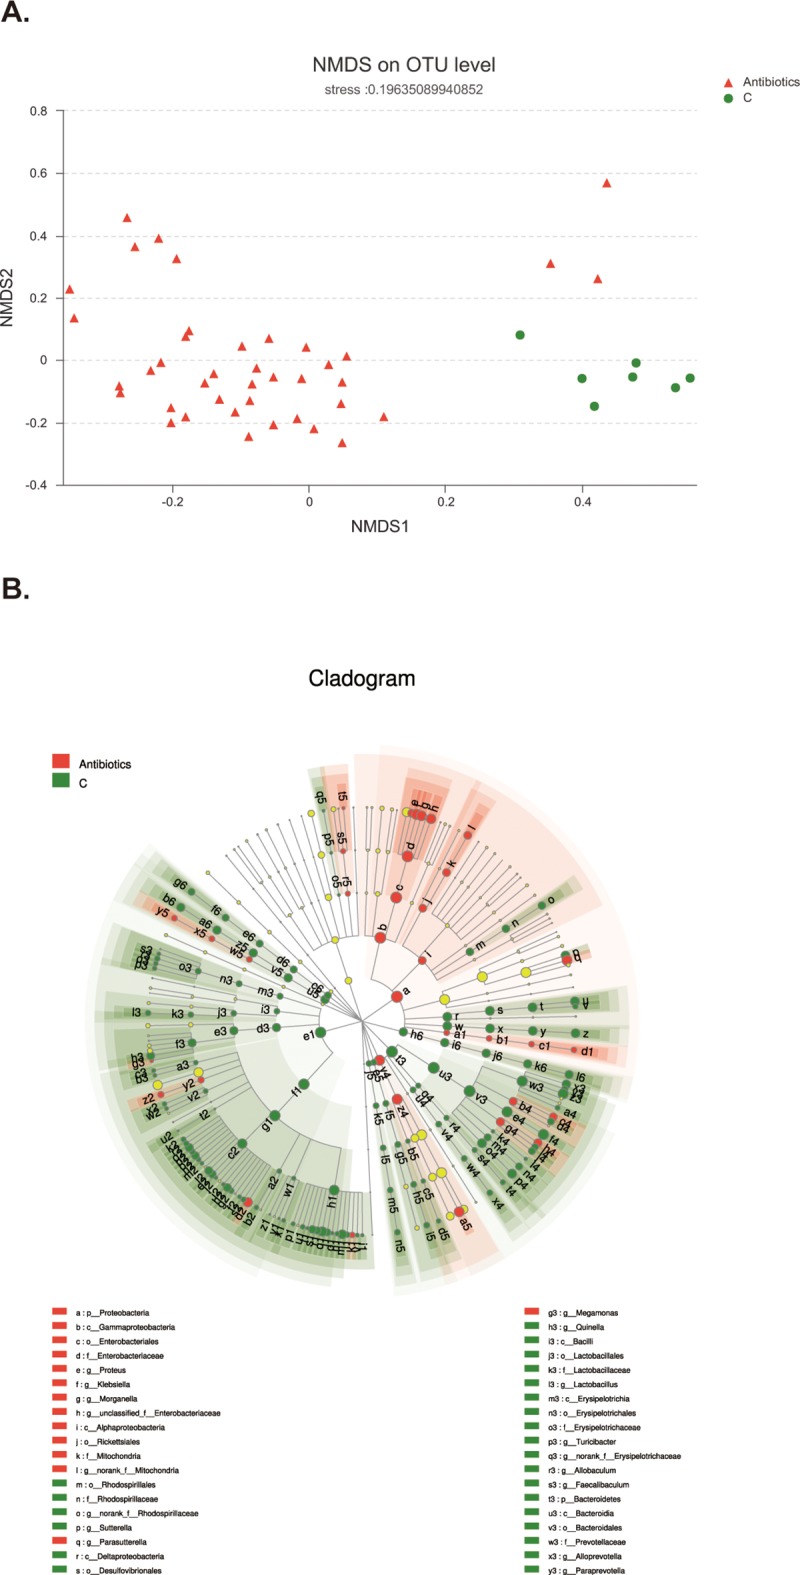
A. The green dots, representing the distributions of samples in control group, mainly distribute at the lower right area. The red triangles, standing for samples of antibiotics group, locate at the left area. B. Green symbolizes the differential bacteria in control group, and red stands for bacteria with significant difference in antibiotics group. Species with in-apparent variation are represented by yellow dot. The circle is segmented into five layers, respectively representing phylum, class, order, family, and genus levels from the inside out.