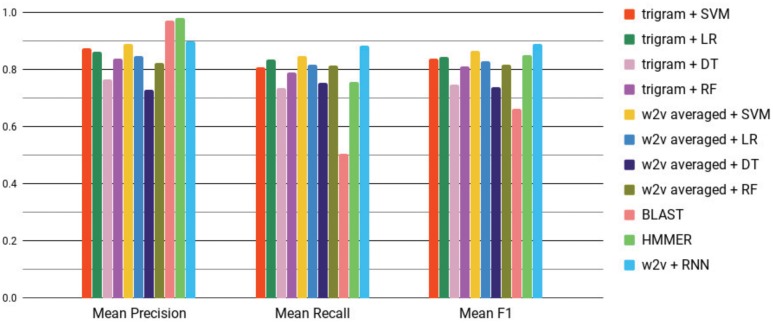
Fig. 7.
Mean F1 scores of different algorithms with both Word2vec (w2v) and baseline representations. Error bars (using standard error) are too small to be shown. W2v + RNN (blue, rightmost bar in each grouping) provides the best F1 score. See Supplementary Table S1 for mean and standard errors values. (Color version of this figure is available at Bioinformatics online.)

