
Fig. 5.
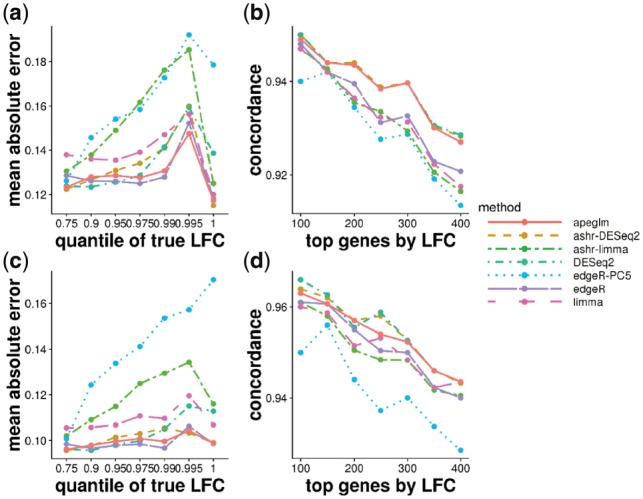
MAE plot over LFCs (left) and CAT plots (right) of simulation dataset (top row, 30 versus 30 and bottom row, 50 versus 50) modeled on estimated parameters from the Pickrell et al. (2010) dataset. Each point represents the average over 10 repeated simulations