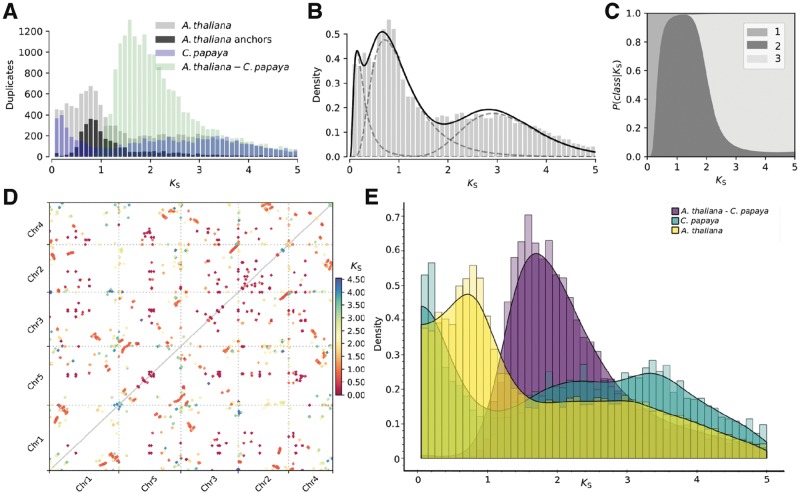
Fig. 1.
Illustration of the various tools and visualizations in wgd. (A) Arabidopsis thaliana and Carica papaya paranome KS distributions overlayed with the KS distribution of anchor pairs for A. thaliana and KS distribution of one-to-one orthologs of C. papaya and A. thaliana. (B) Mixture of three log-normal distributions fitted to the KS distribution of A. thaliana, using the Variational Bayes algorithm with γ = 10−3. (C) Plot showing the probability to belong to a particular component of the mixture shown in (B) in function of KS. These probabilities can be used to define component-wise paralogs for further downstream analyses. (D) KS-colored dotplot for A. thaliana, showing colinear blocks identified by I-ADHoRe, colored by their median KS value. (E) Interactive histogram visualization (user interface not shown, see Supplementary Fig. S1), showing the whole paranome KS distributions using histograms and kernel density estimates for A. thaliana and C. papaya together with the KS distribution of one-to-one orthologs in these species. We refer to the Supplementary Material for detailed methods

