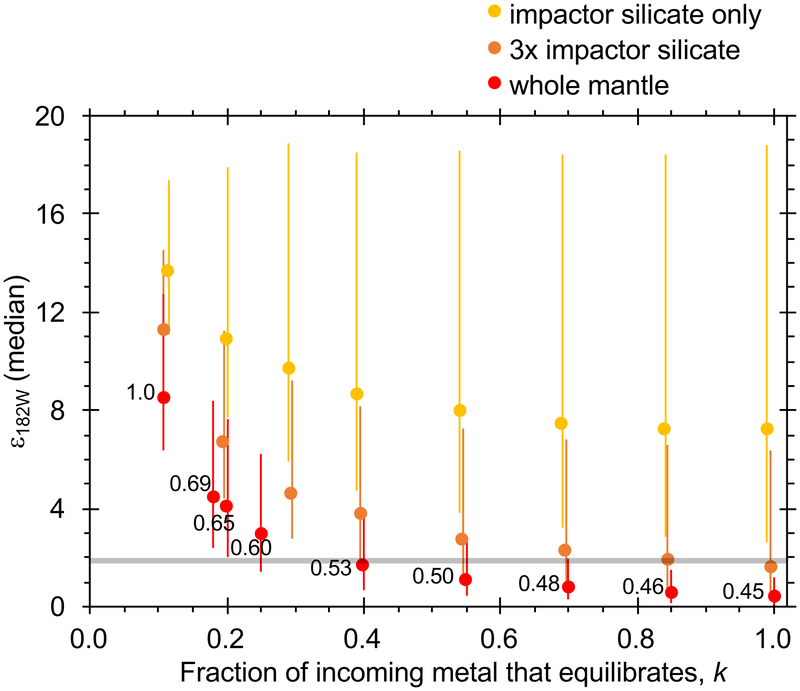
Figure 2:
Effect of partial equilibration of metal and silicate on the resulting mantle 182W anomaly. Each data point is the median of 73 Earth analogues, with error bars representing a 68% two-sided confidence interval. Shaded region indicates Earth value. Data labels are the depth of equilibration (expressed as a fraction of the evolving core-mantle boundary pressure) for the case of whole mantle equilibration. Data are slightly offset horizontally for clarity. Color indicates amount of equilibrating silicate: impactor silicate only (yellow), impactor+target silicate with a mass of 3× that of the impactor silicate (orange), and entire impactor+target silicate (red).

