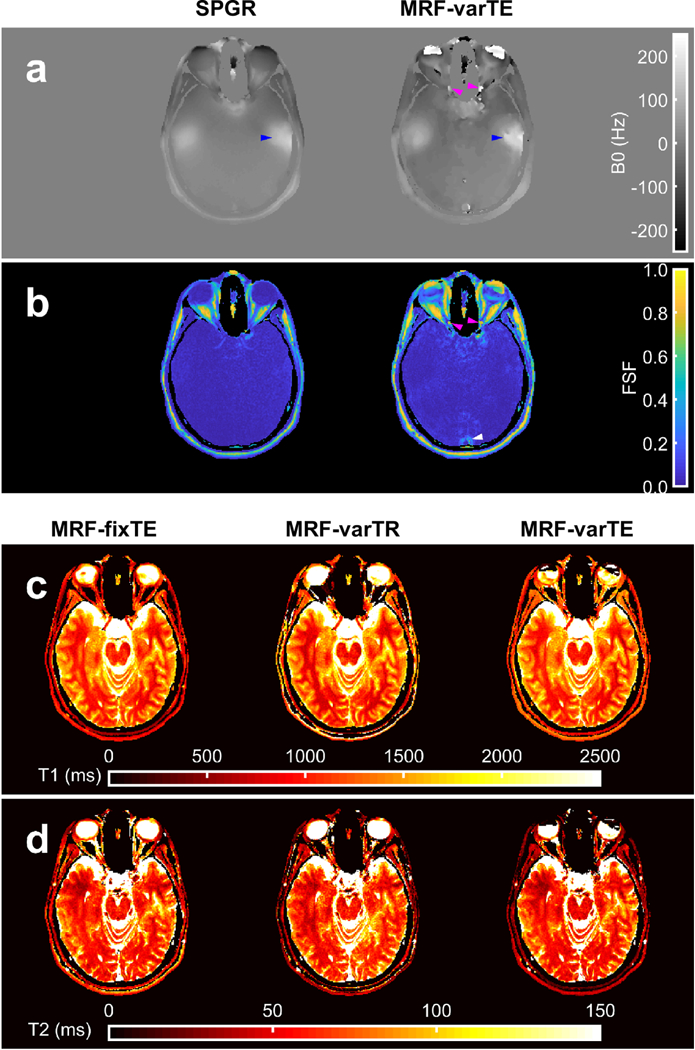
Fig. 10.

Multi-parametric maps of the brain. The B0 maps from the spoiled gradient with graph cut processing (SPGR) and the proposed MR fingerprinting (MRF) fat-water and B0 estimation method with variable TE (MRF-varTE) are shown (a), with the corresponding fat signal fraction maps (b). The MRF method has general agreement with the SPGR. Blue arrows indicate a region superior to the temporal bone featuring increased Bo heterogeneity in both methods, which is also present on the contralateral side (unmarked). Deviations between the methods include fat-water swapping in the anterior orbits and small sections of the optic nerves (magenta arrows), and the MRF FSF map indicates an area of a flow artifact (white arrow). The MRF T1 (c) and T2 maps are shown for the MRF methods without fat-water separation (MRF-fixTE/-varTE) and the proposed fat-water separation using MRF-varTE. The slice thickness (5 mm) is thicker than the optic nerve diameter so may include a partial volume of CSF.
