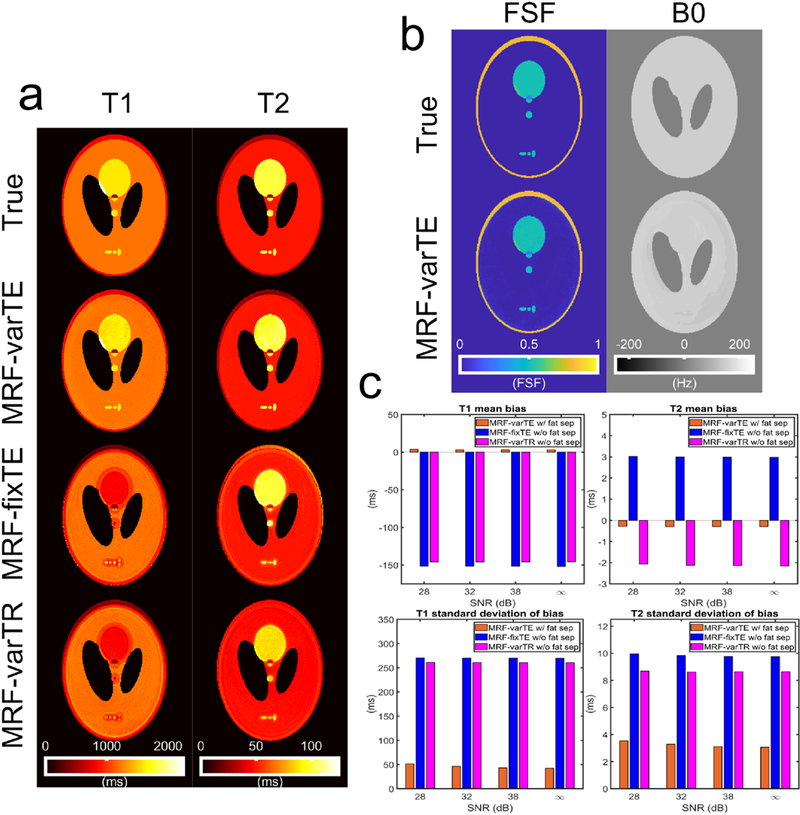
Fig. 3.

Example parameter estimates for the MR fingerprinting image simulations and associated bias plots. The example maps here use an SNR of 28 dB, an undersampling factor of 32, and a spiral acquisition time of 5.0 ms. The T1 and T2 maps (a) from the MRF-varTE sequence with fat separation exhibit reduced bias compared to the MRF-fixTE and MRF-varTR which do not use fat separation or account for spiral blurring due to B0/fat chemical shift. The fat signal fraction and B0 map for the MRF-varTE method (b) generally agrees with the ground truth. T1 and T2 estimation bias and the standard deviation of the bias are reduced at all noise levels for the MRF-varTE with fat separation simulations relative to the MRF techniques without fat separation (c).
