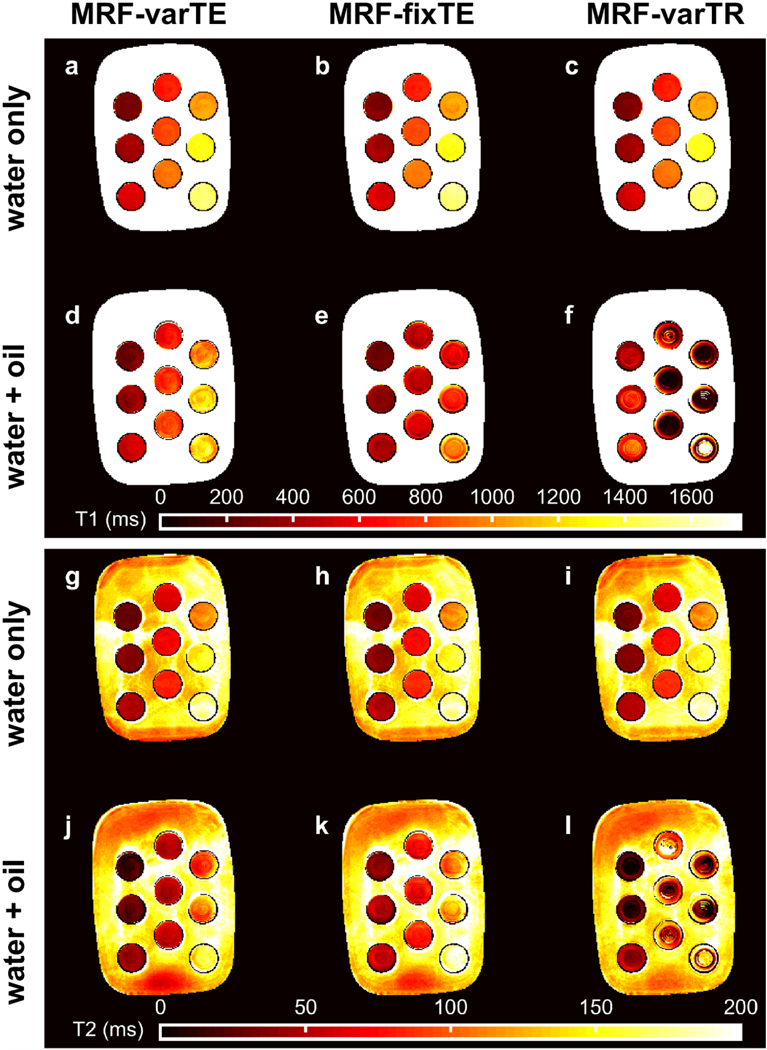
Fig. 4.

The MR fingerprinting (MRF) T1 and T2 maps from the oil-water phantom. The MRF-varTE sequence uses the proposed k-space fat-water separation whereas the MRF-fixTE and MRF-varTR sequences do not separate fat from water. The T1 estimates from a pure water layer within the phantom tubes (a-c) are shown above the T1 estimates from an oil-water layer (d-f). The T2 estimates are arranged as the T1 maps with water-only T2 estimates in (g-i) above the oil-water T2 estimates (j-l) and the same MRF sequence order from left to right. The largest deviations from the water-only T1 and T2 values can be seen in (e, f, l).
