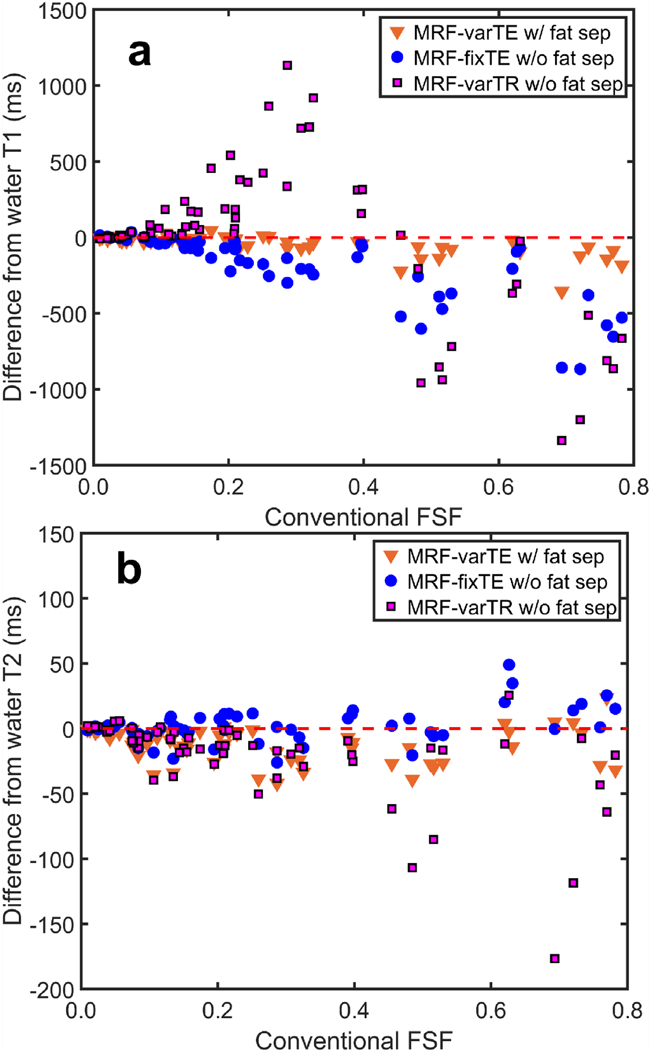
Fig. 5.

The deviations in MR fingerprinting (MRF) estimated T1 and T2 with fat signal fraction (FSF) in the oil-water phantom. The difference from the consensus T1 estimates for all T1/T2 tube combinations and all measured slices is shown for the proposed k-space fat-water separation (MRF-varTE) and fixed-TE/variable-TR MRF methods without fat-water separation, plotted against FSF estimated from a spoiled gradient echo sequence (a). The changes in T2 versus FSF are plotted in (b).
