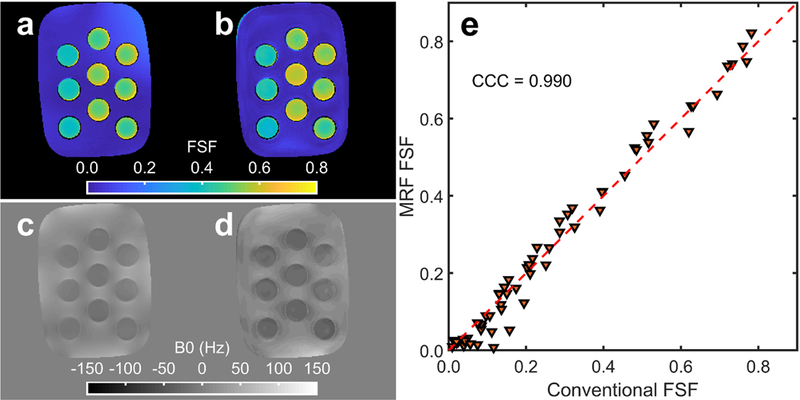
Fig. 6.

Example fat signal fraction (FSF), B0 maps and FSF concordance over a large range of T1/T2’s from the oil-water phantom. The conventional spoiled gradient echo (SPGR) (a) and proposed MR fingerprinting (MRF) (b) FSF estimates are shown with the estimated SPGR (c) and MRF (d) B0 maps from the oil-water phantom slice shown in Fig. 4. The FSF concordance between the MRF and SPGR method is plotted in (e) for all measured water/oil-water layers across all T1/T2 tube combinations with the concordance correlation coefficient (CCC) displayed.
