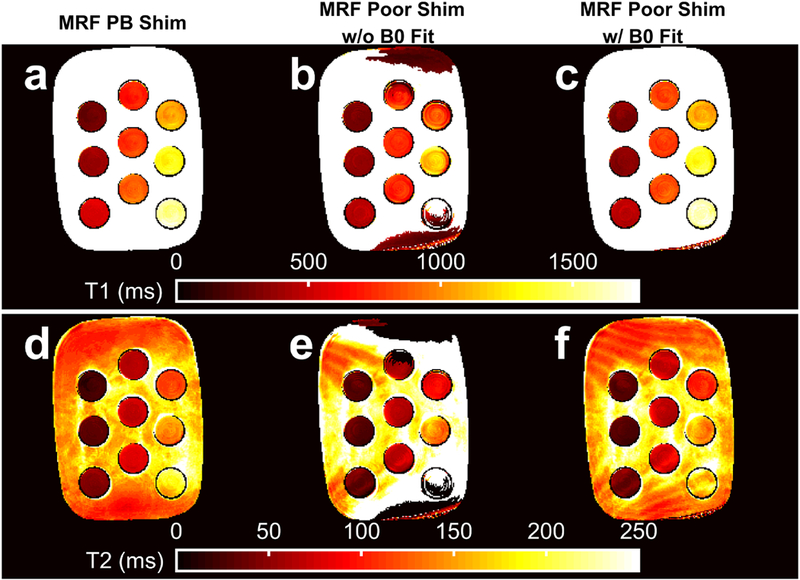
Fig. 8.

The MR fingerprinting (MRF) estimated T1 and T2 maps without and with B0 correction. Variable TE MRF T1 and T2 maps with pencil-beam (PB) shimming (a, d) are shown for comparison with poorly shimmed T1 and T2 maps from MRF k-space fat-water separation without B0 correction (b, e) and k-space fat-water separation with Bo correction (c, f). The data are from the same slice as depicted in Fig. 7.
