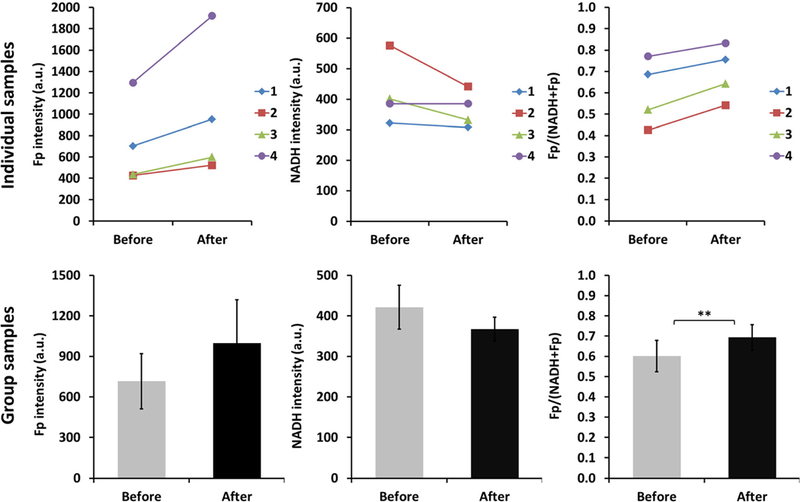
Fig. 2.

The 4 % PFA fixation effect on the redox signals of living muscles of mouse legs (N = 4). Number 1, 2, 3, and 4 indicate 4 individual samples and each sample was measured before and after fixation by imaging the same FOV. In the bar graph of group samples, the values are mean ±SE (standard error). ** indicates p < 0.01.
