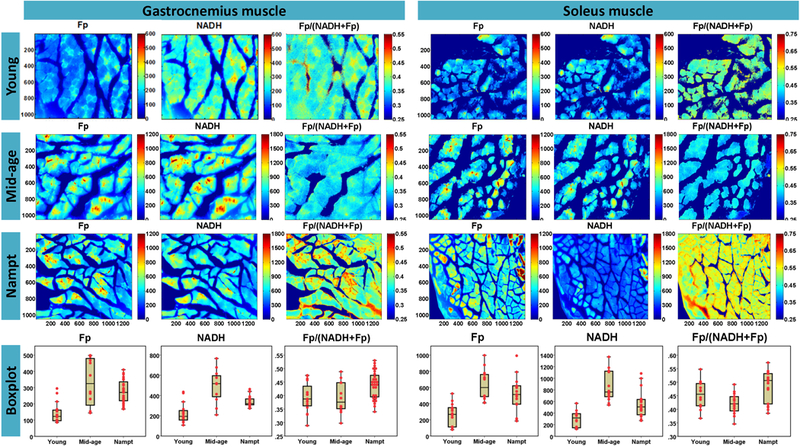
Fig. 4.

Representative redox images of FFPE unstained tissue slides from young and mid-age and Nampt-overexpressed groups (pixel size: 0.35 μm). For the better view of the fine structures, the Fp and NADH color scale bars for the young muscle were set differently from the other two groups. The box of the dotted boxplots indicate the lower adjacent value, first quartile, median, third quartile, and upper adjacent value of the redox indices for a specific group; and the dots represent the mean values of the redox index measurements of individual fields of view.
