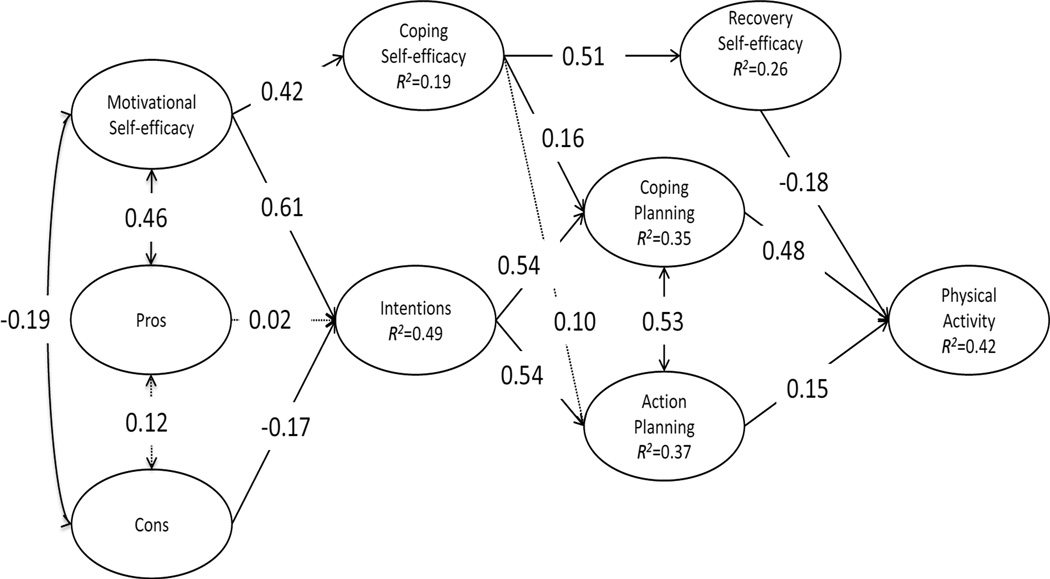
Figure 1.
Associations between the constructs of the Health Action Process Approach. Item indicators were removed to enhance clarity. Single arrows represent path coefficients, whereas double arrows represent correlations. Severity was eliminated from the model because it was not significantly associated with the remaining constructs. Associations were adjusted for age, stage of diagnosis, years out from diagnosis, number of comorbidities, and body mass index. Solid lines represent statistically significant relationships, whereas dashed lines represent non-significant relationships.

