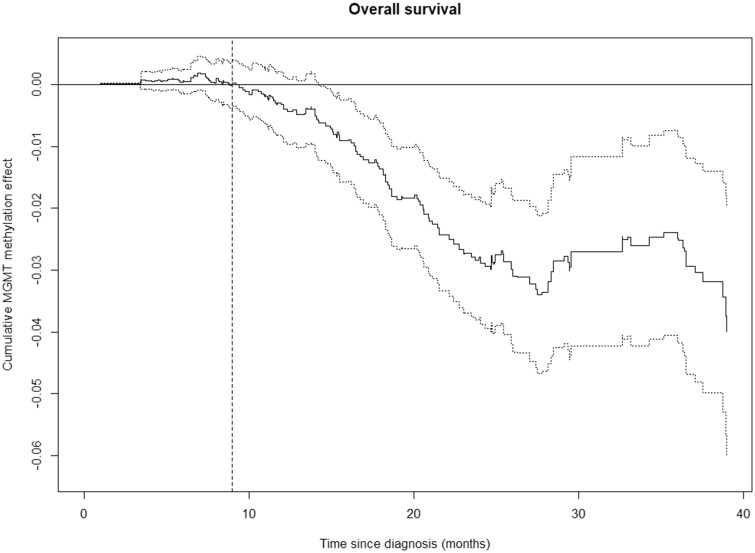
FIGURE 1.
Time-varying effects of MGMT methylation level on OS (solid line) with 95% confidence bands (dotted lines) according to Aalen’s additive hazard model, n = 226. There is no cumulative effect of the MGMT methylation level during the first 9 months after diagnosis, indicated by the horizontal curve. After 9 months, the MGMT level becomes associated with OS, indicated by the curve sloping away from zero with 95% confidence bands below zero. After ∼24 months, the curve levels out suggesting a weaker influence of the MGMT methylation level on OS from that point, although the pattern is less clear due to the wide confidence bands.

