
Figure 1. MRI parameter maps and histograms at baseline (air breathing) for a representative subcutaneous 13762NF tumor (#12).
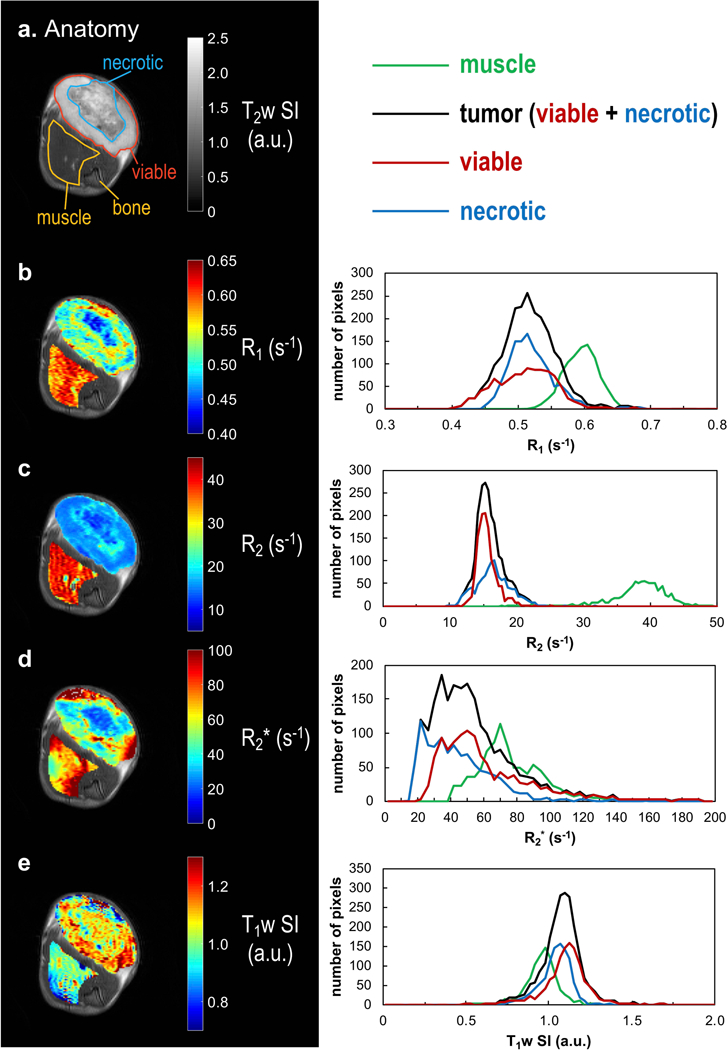
a: T2w anatomical image with the transaxial view of the tumor-bearing thigh. ROIs were manually selected. Muscle ROI (yellow) was selected excluding the thigh bone region. b–e: maps of baseline R1, R2, R2*, and T1w SI, respectively (left panel) and the corresponding histograms (right panel). To illustrate the viable and necrotic tumor regions, respectively, the red and blue ROIs (a) were drawn based on the visual contrast in the parameter maps (b–e) with reference to the H&E staining (Fig. 2f).