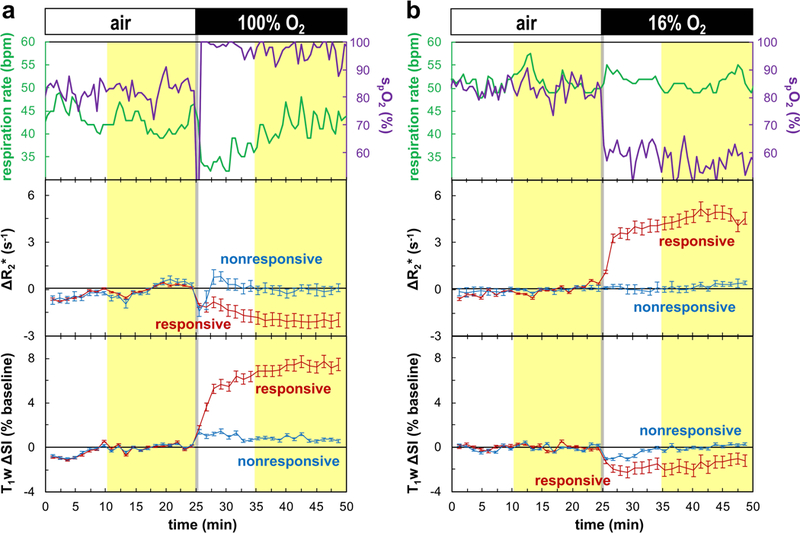
Figure 3. Time courses of oxygen-sensitive parameters with respect to gas breathing challenge using (a) 100% O2 and (b) 16% O2 (subcutaneous tumor #7).

Top row: physiological parameters (respiration rate (green); peripheral arterial oxygen saturation, spO2, on the forearm (purple)); middle row: ΔR2*(t) (Eq. 4a); bottom row: T1w ΔSI(t) expressed as percentage of baseline (Eq. 4b). The time courses for responsive (red) and nonresponsive (blue) classes are shown separately (mean ± SEM at each time point), based on the BOLD and TOLD classification, respectively (Eq. 7; Fig. 2). The designated baseline and challenge intervals (Eq. 5) are highlighted in yellow. Data within these intervals were used to calculate the mean parameter changes (Eq. 6; Figs. 5 and 6). Switch of gas is marked by the gray vertical lines.
