
Figure 5. Mean ΔR2* (a) and T1w ΔSI (b) associated with the BOLD responsive regions in subcutaneous tumors.
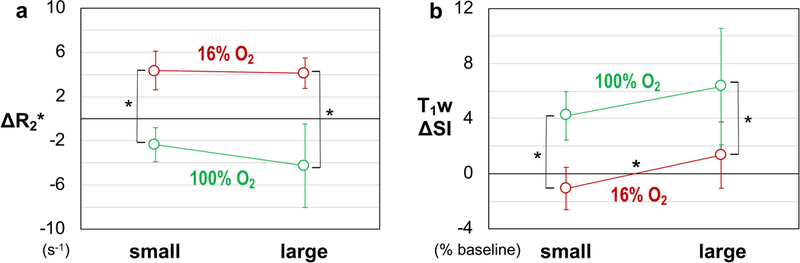
Values are shown as group mean ± SD, according to the type of challenge and volume category. Asterisks mark significant difference (p < 0.05) between groups.