
Figure 6. Two-parameter oxygenation profile for individual tumors.
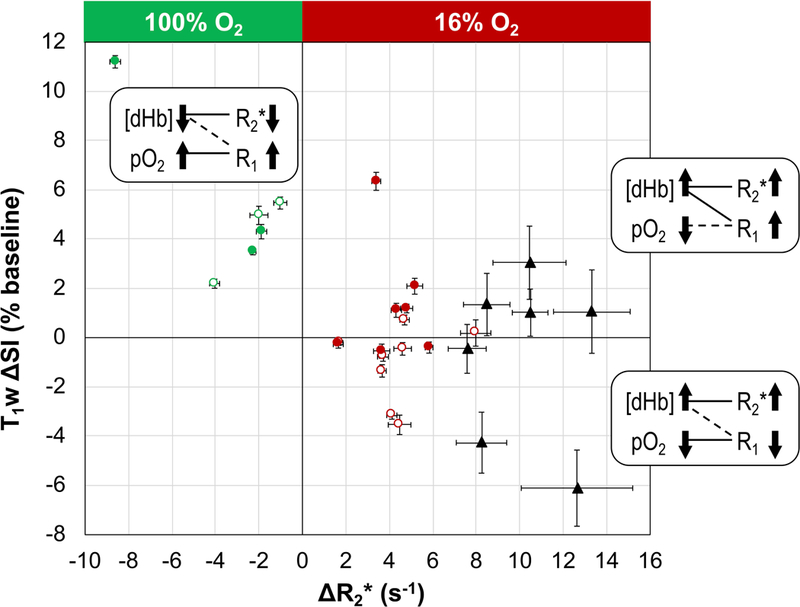
Each tumor is located according to the ΔR2* and T1w ΔSI values (mean ± SEM) associated with the BOLD responsive voxels. Data points are labeled according to tumor location and challenge type: open circles for small SC tumors; filled circles for large SC tumors; red circles for gbc16; green circles for gbc100; black triangles for OT tumors in the lower mammary fat pad (gbc16). Proposed contributing factors ([dHb] and pO2) underlying the tumor responses are given in the corresponding quadrants. The solid connecting lines indicate the dominating factor, while the dashed connection lines indicate the minor factor.