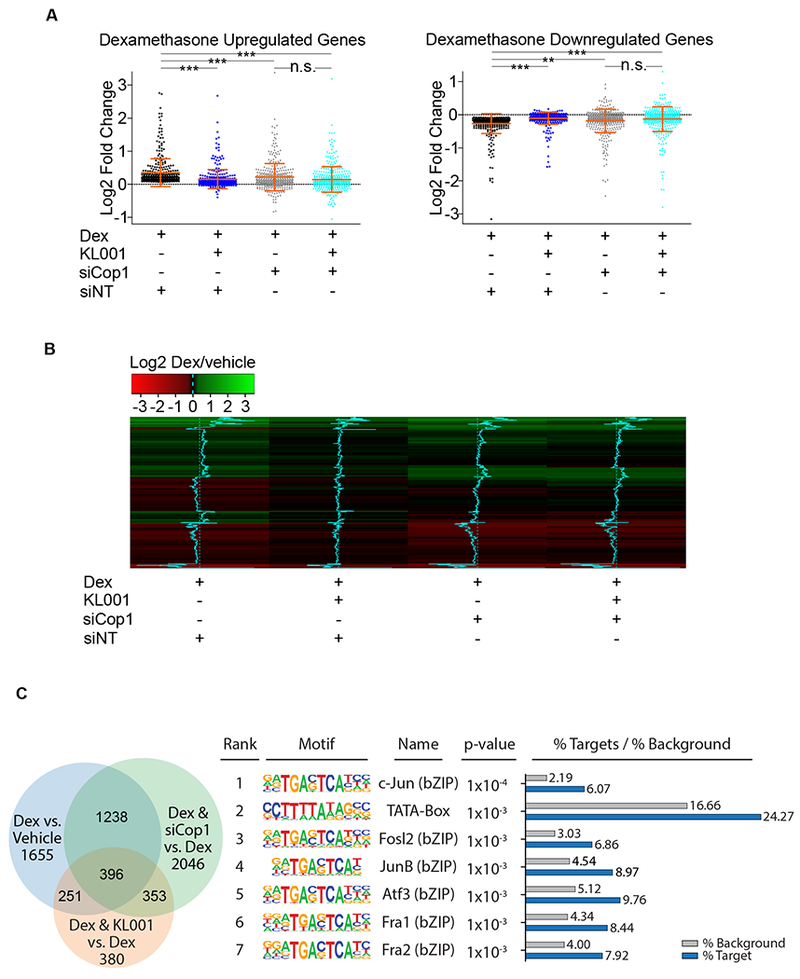
Figure 2. Cop1 mediates the cryptochromes-dependent repression of the GR transcriptional network.

(A) RNA isolated from MEFs treated with dexamethasone, with and without KL001 in the presence or absence of Cop1 knockdown was quantified by RNA-seq. Differential expression analysis of RNA-seq data sets, [see next-generation sequencing data deposited in Gene Expression Omnibus (GEO) database under the accession code GSE124388] is represented in the scatter plots as log2 fold change for 792 genes divided in upregulated and downregulated (370 and 422, respectively). Dexamethasone-regulated genes were considered differentially expressed when the p-adjusted value was <0.05. n=3 biologically independent experiments.
(B) Heatmap as log2 fold change for 370 upregulated and 422 downregulated genes shown in (A).
(C) RNA isolated from MEFs treated with dexamethasone, with and without KL001 in the presence or absence of Cop1 knockdown was quantified by RNA-seq. Left, Venn diagram represents all genes which were significantly differentially expressed among all conditions. [see next-generation sequencing data deposited in Gene Expression Omnibus (GEO) database under the accession code GSE124388]. Right, a table showing the first 7 most highly overrepresented motifs within the promoter regions of 396 genes that were differentially expressed under all three tested conditions. See also Figure S1.
