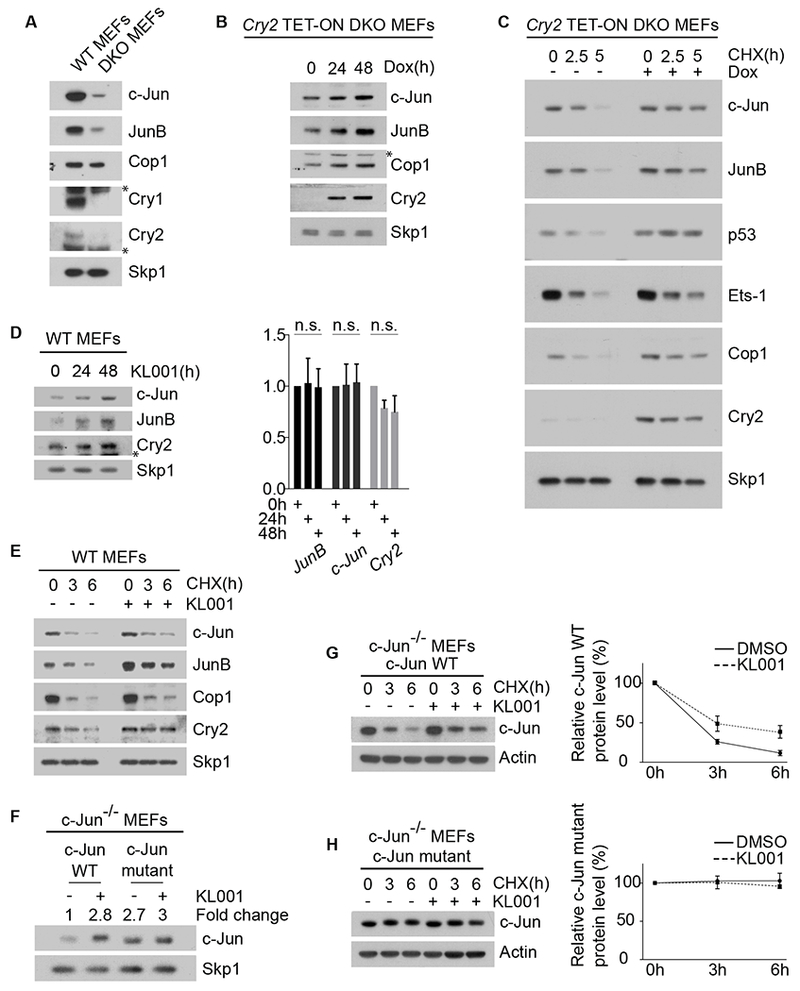
Figure 4. Cry2 controls the level and stability of Cop1’s substrates.

(A) Cell extracts of wild-type MEFs and DKO MEFs were analyzed by immunoblotting. The asterisks indicate cross-reacting bands.
(B) Western blot analysis of Cop1’s substrates in DKO MEFs infected with lentiviruses expressing untagged human Cry2 under the control of a doxycycline-inducible promoter. After doxycycline treatment, cells were collected, lysed and immunoblotted. The asterisk indicates a cross-reacting band.
(C)The experiment was performed as in (B), except that, one day after infection, DKO MEFs were treated with cycloheximide (CHX) for the indicated times.
(D) Left, wild-type MEFs were treated with 10 μM KL001 for the indicated times before they were collected and analyzed by immunoblotting. The asterisk indicates a cross-reacting band. Right, qPCR analysis of cDNAs prepared from the same samples.
(E) Wild-type MEFs were treated with 10 μM KL001 for 18 hours. Cells were then treated with CHX for the indicated times and cells extracts were analyzed by immunoblotting.
(F) c-Jun−/− MEFs stably expressing either wild-type c-Jun or a degron mutant of c-Jun were treated for 2 days with 10 μM KL001 and then analyzed by immunoblotting. The fold change indicates the protein levels of wild-type c-Jun and c-Jun mutant after densitometric analysis of the blot.
(G) c-Jun−/− MEFs stably expressing wild-type c-Jun were treated overnight with either vehicle or 10 μM KL001. CHX was applied for the indicated times and cells extracts were analyzed by immunoblotting. The graph shows the quantification of protein levels ±SEM (n = 3 biologically independent experiments).
(H) The experiment was performed as in (G), except that MEFs stably expressed a c-Jun mutant in its Cop1’s degron. See also Figure S2.
