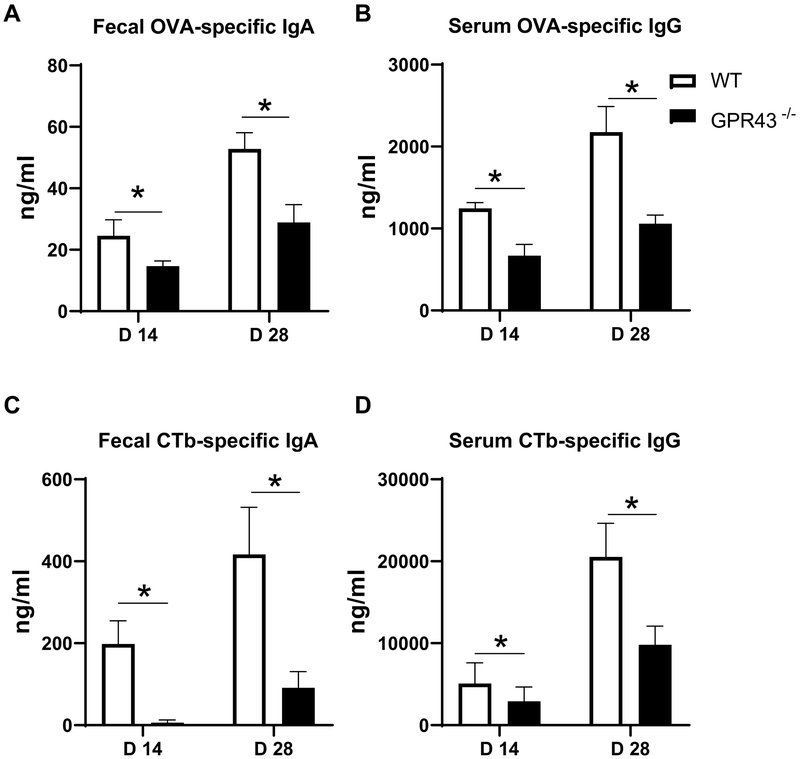
Figure 3. Impaired CT adjuvant activity in GPR43−/− mice.
Groups (n = 4–5) of GPR43−/− and WT mice were immunized with 100 μg OVA and 10 μg CT on day 0 and day 14 by gavage. Feces and serum samples were collected on days 14 and 28. OVA-specific IgA (A) and CTb-specific IgA (C) in fecal, and OVA-specific IgG (B) and CTb-specific IgG (D) in serum were measured by ELISA. One representative of three independent experiments was shown. The data were expressed as mean ± s.e.m. *p < 0.05.

