Figure 1:
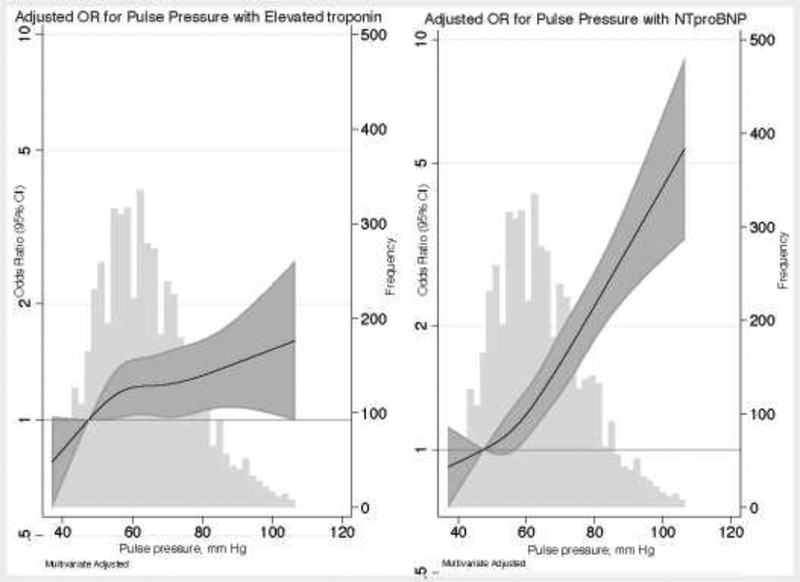
Adjusted odds ratio (95% CI) for association of pulse pressure with (A) elevated hs-cTnT or (B) elevated NT-proBNP
Relationship between pulse pressure and elevated high sensitivity cardiac troponin T (hs-c-TnT ≥14 ng/l), graph on the left (panel a) and elevated NT-pro BNP (≥100 pg/ml), graph on the right (panel b). Hs-cTnT and NT-proBNP were modeled using restricted cubic splines with knots at 44.5, 57, 67.5 and 88 mmHg. The odds ratio was adjusted for age, gender, and race-center, body mass index, diabetes status, hypertension medication use, cholesterol lowering drug use, LDL-cholesterol, HDL-cholesterol, triglycerides, smoking status, drinking status, estimated glomerular filtration rate, prevalent coronary heart disease and mean arterial blood pressure. The distribution (frequency histogram) of pulse pressure is shown in grey in the background. The shaded area around the regression line represents the 95% confidence interval (CI).

