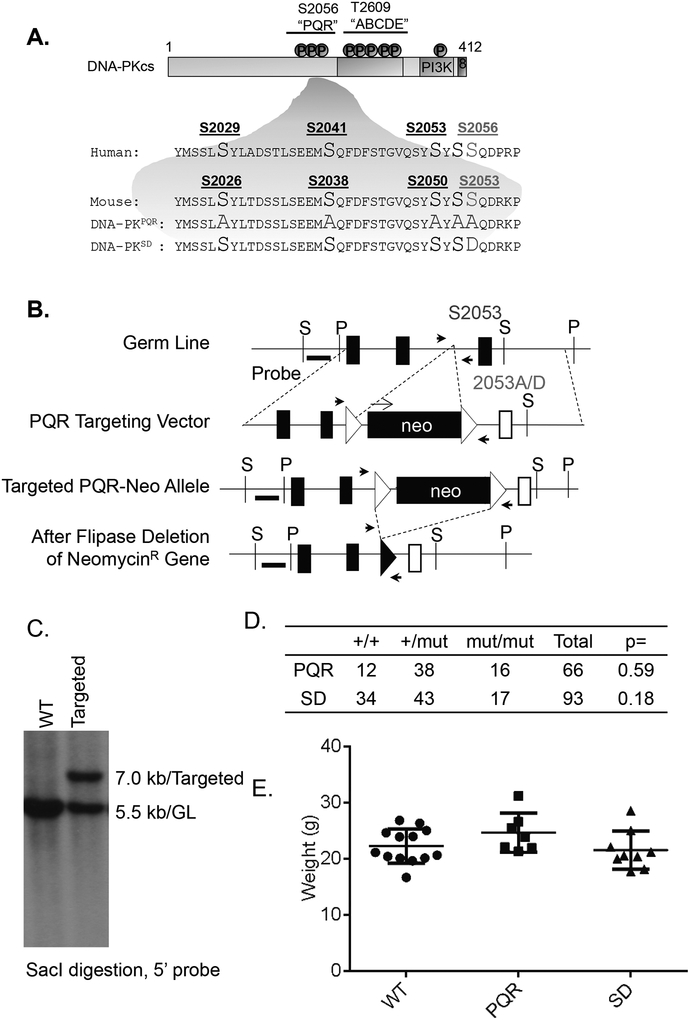
Figure 1. Generation of the DNA-PKcsPQR/PQR and DNA-PKcsSD/SD mouse models.
(A) Diagram of the S2056 (S2053 in mouse) cluster of DNA-PKcs in human and mouse. (B) The targeting scheme of DNA-PKcsPQR and DNA-PKcsSD allele. Murine DNA-PKcs locus (top), targeting vectors (2nd row), targeted allele (3rd row), and the neo-deleted allele (DNA-PKcsPQR and DNA-PKcsSD, bottom). The Neo-R cassette was inserted at ~600bp upstream from the S2053D mutation site. Not all exons on the arm were marked. P=PstI site and S=SacI site. The 5’ and 3’ probes are marked as thick black lines. The exons and FRT sites are shown as solid boxes and open triangles, respectively. The genotyping primers are marked as solid black arrows. A set of representative genotyping results is shown in Supplementary Figure 1C. The map is not drawn to scale. This clone contains the Neo-R cassette, which is subsequently deleted upon breeding with the constitutive ROSAFLIP/FLIP allele (JAX 003946). The open box indicates the mutated exon (A2053-PQR) and the filled-box indicates the WT exon (S2053). (C) Southern Blot analyses of SacI-digested DNA from DNA-PKcs+/+ and DNA-PKcsPQR targeted ES cells, blotted with the 5’ probe. WT (7.0kb) and targeted (5.5 kb) clone (GL: germline). (D) Breeding frequency to obtain DNA-PKcsPQR and DNA-PKcsSD mice from heterozygous crossing. P value was calculated based on the Fisher exact test. (E) The body weight of adult DNA-PKcsPQR/PQR, DNA-PKcsSD/SD and control mice. The bar represents the average and standard error. The p-value was calculated using student’s t-test. “n.s.” = not significant.

