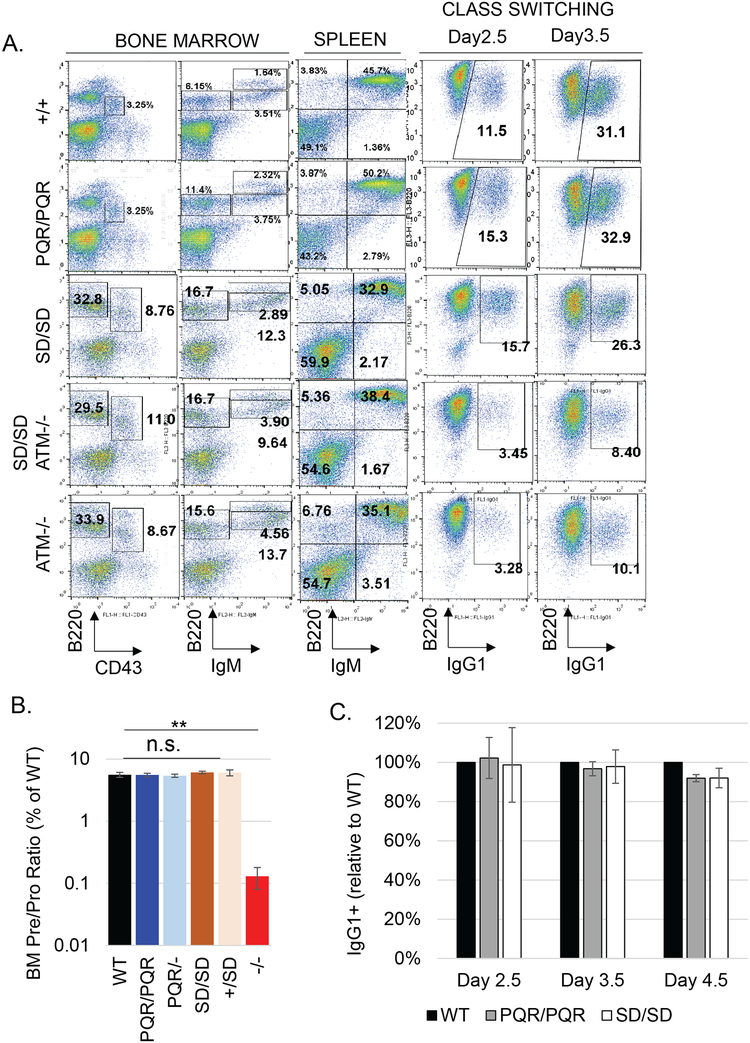
Figure 4. Normal B lymphocyte development and class switch recombination in DNA-PKcsPQR/PQR and DNA-PKcsSD/SD mice.
(A) Representative flow cytometry analyses of the development in the bone marrow and spleen and in vitro class switch recombination of B cells from DNA-PKcs+/+, DNA-PKcsPQR/PQR, DNA-PKcsSD/SD as well as DNA-PKcsSD/SDATM−/− and ATM−/− mice. (B) Quantification of bone marrow PreB (B220+IgM-CD43-) vs ProB (B220+IgM-CD43+) B cell ratio in the bone marrow. More than three biological repeats were performed for each genotype. (C) The quantification of CSR kinetics in purified B cells activated in vitro. The bar represents the average and standard error. The p-value was calculated using student’s t-test. n.s. = not significant, and **<0.01.

