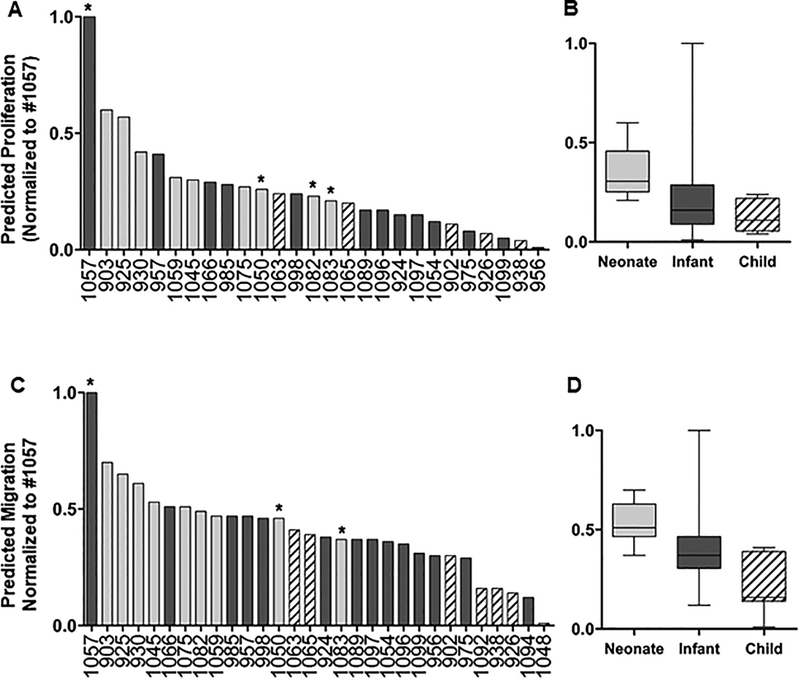
Figure 3.
Prediction analysis of selected hCPCs. Top 300 RNA-seq data from pediatric CPCs were used in our predictive model and proliferation (A,B) and migration (C,D) responses for each patient were determined. Many of the neonates (gray bars) cluster together and reside close to the top with the most functional improvement. Most child CPCs (striped bars) cluster together near the bottom with the least functional improvement and infants (black bars) cluster together and reside intermediately between neonate and child patients. There are outliers in each age group that reside outside of their cluster (such as neonates #1050 and #1083, and infant #1057 labeled with asterisks. Each sample is normalized by the highest scoring individual for each function (Infant #1057).

