Figure 4.
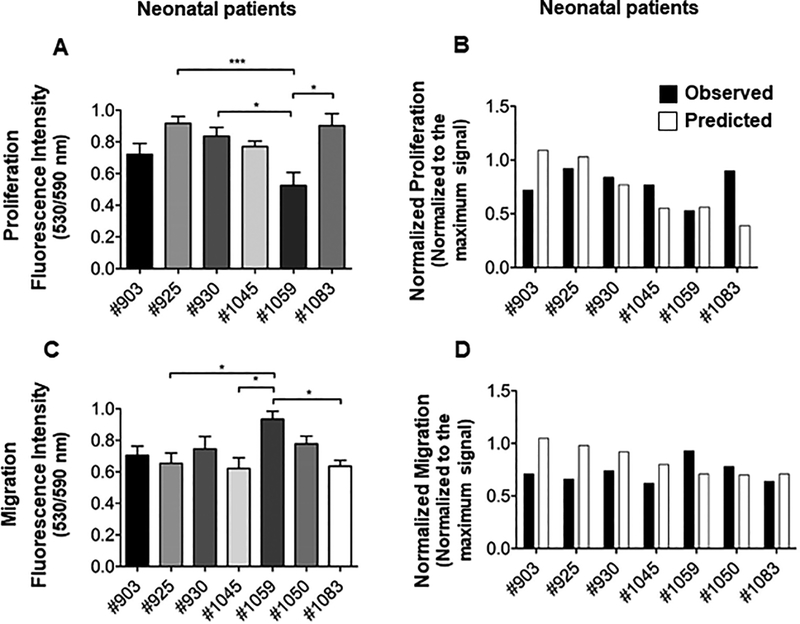
Proliferation and migration analysis and validation of the predictive model. (A). Proliferation analysis of neonate CPCs in vitro. Cell proliferation assay was performed on 10,000 cultured CPCs of each neonate using Click iT-Edu microplate assay and the absorbance was calculated after 24 hours of incubation. Some neonate CPCs showed a higher proliferation rate compare to the others. Absorbance was normalized to the maximum signal. N=5 replicates for each cell line; ANOVA followed by Tukey test, P<0.05. (B). Comparison of in vitro proliferation responses and the predicted responses. Observed proliferation response for each neonate patient was plotted against its predicted response. Proliferation assay was not performed with neonatal #1050 cell lines. This cell line was lost after collecting the conditioned media for migration assay. (C). Migration analysis of neonate CPCs in vitro. Migration assay was performed by applying conditioned media obtained from each neonate CPC on human mesenchymal stem cells (MSCs) in a Boyden chamber. Migrated cells were labeled with CMRA and cell migration was quantified after 24 hours by measuring CMRA fluorescence intensity. Absorbance was normalized to the maximum signal. N=4 replicates for each cell line; One-way ANOVA followed by Tukey test, P<0.05. (D). Comparison of in vitro migration responses and the predicted responses. Observed migration response for each neonate patient was plotted against its predicted response.

