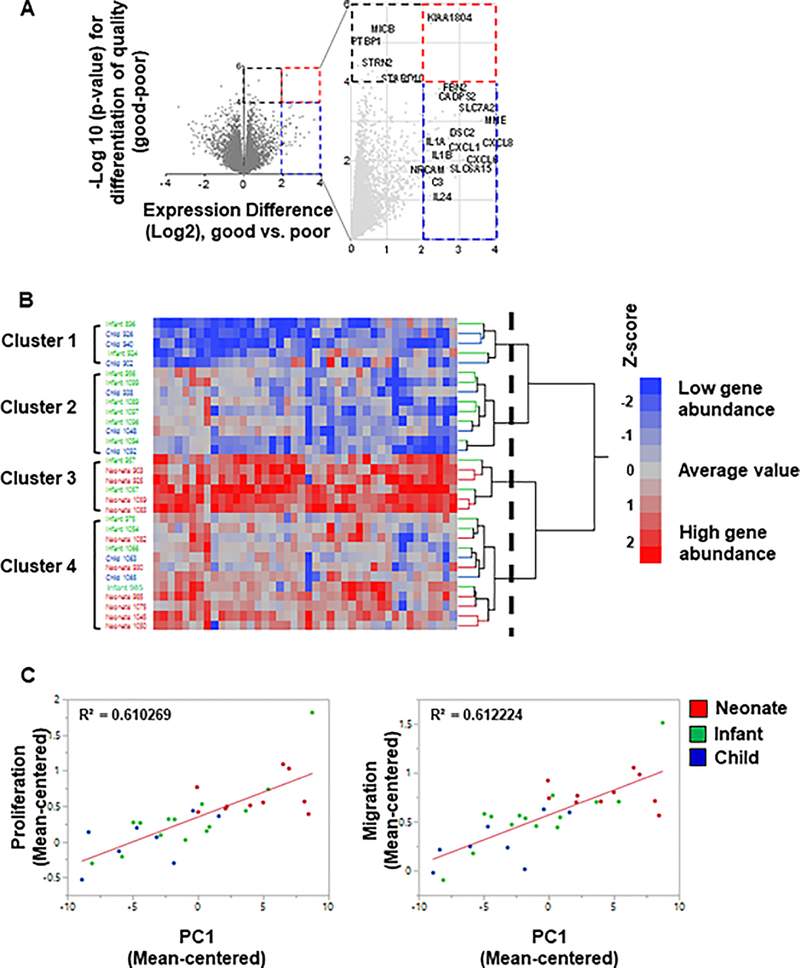
Figure 5.
Transcriptomic analysis of hCPC and potential effectors. (A) Volcano plot of GOOD vs POOR patient (neonate, infant, child) comparison. A volcano plot of significance (negative log of the p-value) against difference in abundance (log2 scale) of genes was plotted between good and poor c-kit+ progenitor cells. Dashed blue square represents genes that are upregulated in good vs poor CPCs but not statistically significant. Signals residing in the red dashed square are genes that are significantly upregulated in good vs poor CPCs (p-value <0.0001). Genes are indicated by gray circles. Many immune response related genes including interleukins and cytokines are present among differentiated genes. (B) Two-way hierarchical cluster analysis of differentially expressed CPC genes using Ward’s method. Two-way hierarchical analysis was performed on the same 42 genes between neonates (red labels), infants (green labels), and children (blue labels). The dashed vertical line indicates the cutoff on the dendrogram used to define the four clusters. (C) Correlated genes with proliferation and migration functions. The differentially upregulated genes showed high correlation with both proliferation and migration functions (running a regression analysis; R2=0.6 for both functions).

