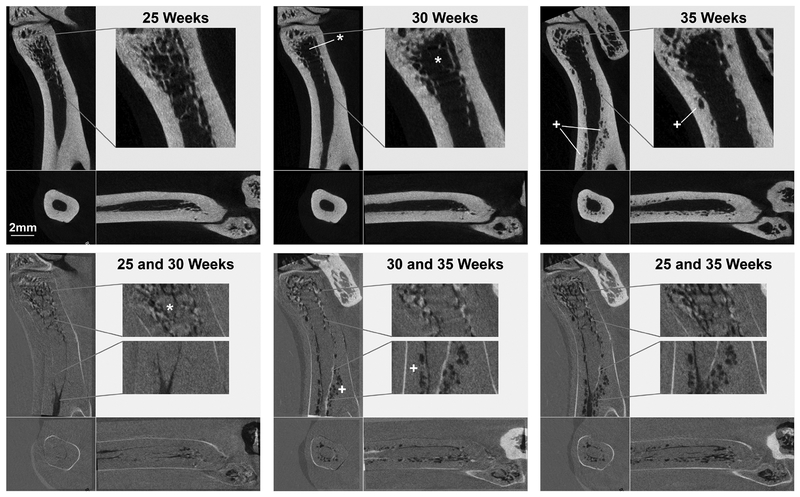
Figure 3 -.
Registered scans (top row) from a representative CKD animal illustrate the large cortical porosity formation (+) observed between 30 and 35 weeks. Trabecular bone loss (*) was present by 30 weeks, Over-lays of 25 and 30, 30 and 35, and 25 and 35 weeks (bottom row) highlight the locations and timing of bone loss, with dark and light regions identifying areas of removed and added bone, respectively.

