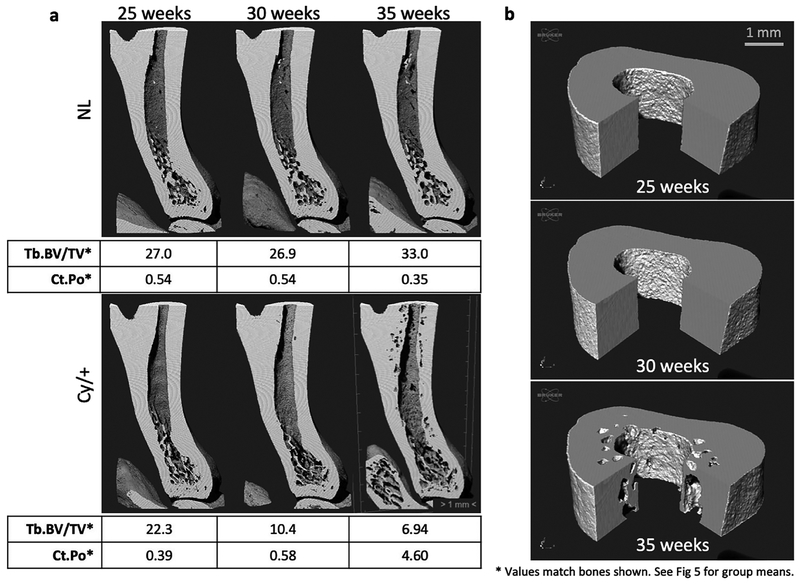
Figure 4-.
3D renderings of longitudinal tibia scans for a NL and a CKD animal. (a) Registered cross-sectional views are shown along with corresponding values of trabecular BV/TV (%) and cortical porosity (%) for the bones shown. CKD trabecular bone loss preceded cortical porosity formation. (b) Cut views of the cortical VOI for the same CKD animal demonstrate the endosteal clustering and first appearance of cortical porosity at 35 weeks.

