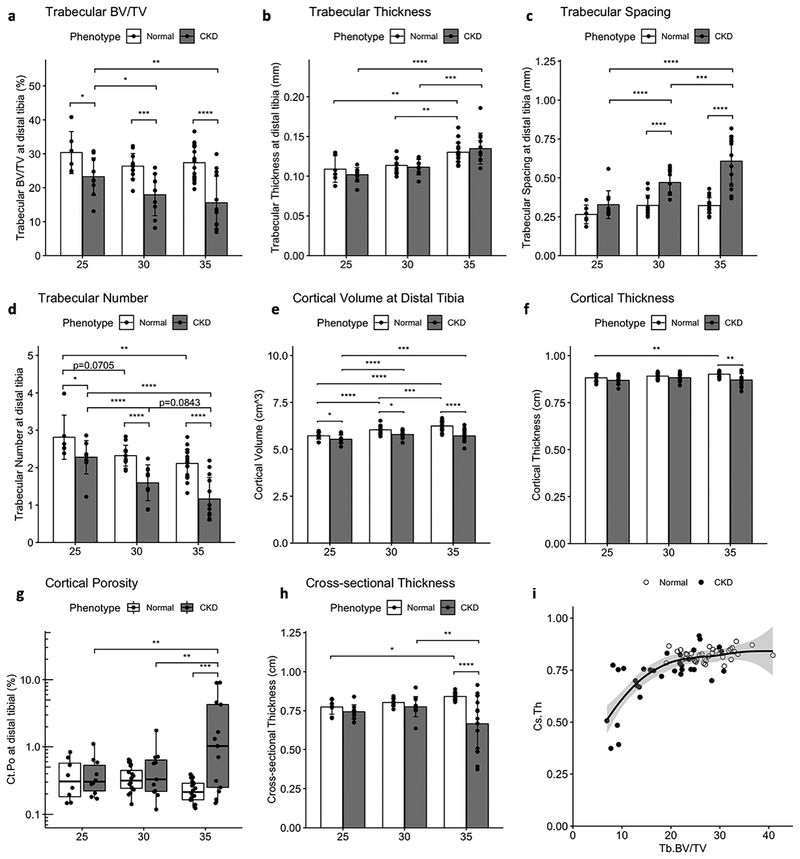
Figure 5 -.
Longitudinal measures of trabecular and cortical bone volume at the distal tibia. CKD animals had increasing reductions in trabecular bone volume fraction (a) driven by a reduction in trabecular number (d) and increased spacing (c). Cortical volume (e), cortical thickness (f), and cortical cross-sectional thickness (h) were increasingly reduced compared to NL over the 10-week study. CKD levels of cortical porosity (g) were only increased at 35 weeks. A scatterplot with LOESS curve fit (i) shows the nonlinear biphasic relationship between trabecular BV/TV and cross-sectional thickness measured for each animal at 25, 30 and 35 weeks; Ct.Cs.Th is reduced below a Tb.BV/TV threshold of ~20%. Bar plots show mean +/− SD. Cortical porosity is shown with a box and whisker plot and log axis to accommodate the strongly skewed distribution. *p <= 0.05; **p <= 0.01; ***p <= 0.001; ****p <= 0.0001

