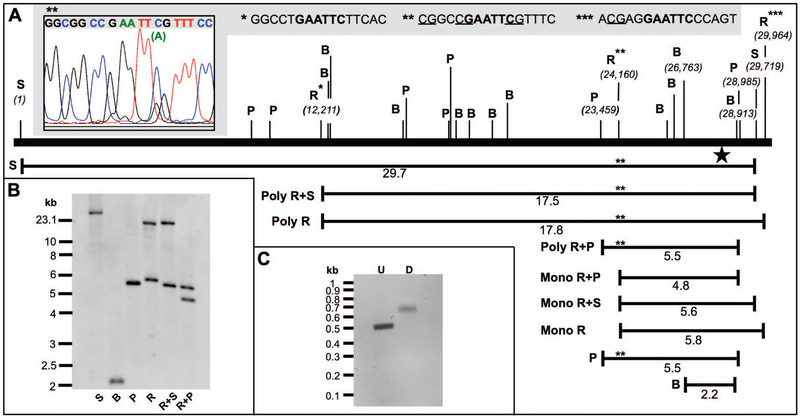
Fig. 2.
Restriction endonuclease mapping of the repetitive 18S rDNA loci using the nDNA-specific DIG-labeled probe. A. Map of the human 18S region emphasizing the location and position of important RE sites. The star indicates the probe-binding site. Three EcoRI restriction sites are emphasized with asterisks. The DNA sequences for each of the EcoRI sites are emphasized in bold text in the gray box at the top of the figure and putative CpG methylation sites are underlined. Sanger DNA sequencing of a PCR product harboring the HepaRG polymorphic EcoRI site, Poly R site (**), revealed a minor A peak under the C peak of the EcoRI sequence (inset, upper left-hand-side). The unexpected high MW bands in each of the R, R+S, and R+P reactions likely result from a failure of EcoRI to cut at Poly R due to a combination of CpG methylation and the C>A polymorphism. Failure of EcoRI to cut at Poly R would result in 17.5 (Poly R+S), 17.8 (Poly R), and 5.5 (Poly R+P) kb bands. Mono R, the expected monomorphic or wild-type EcoRI fragment. B. A representative Southern blot of HepaRG whole-cell DNA samples digested with key REs. C. A 1.2% agarose gel with unlabeled (U) control and DIG-labeled (D) PCR products generated using the 18SF and 18SR primer set.

