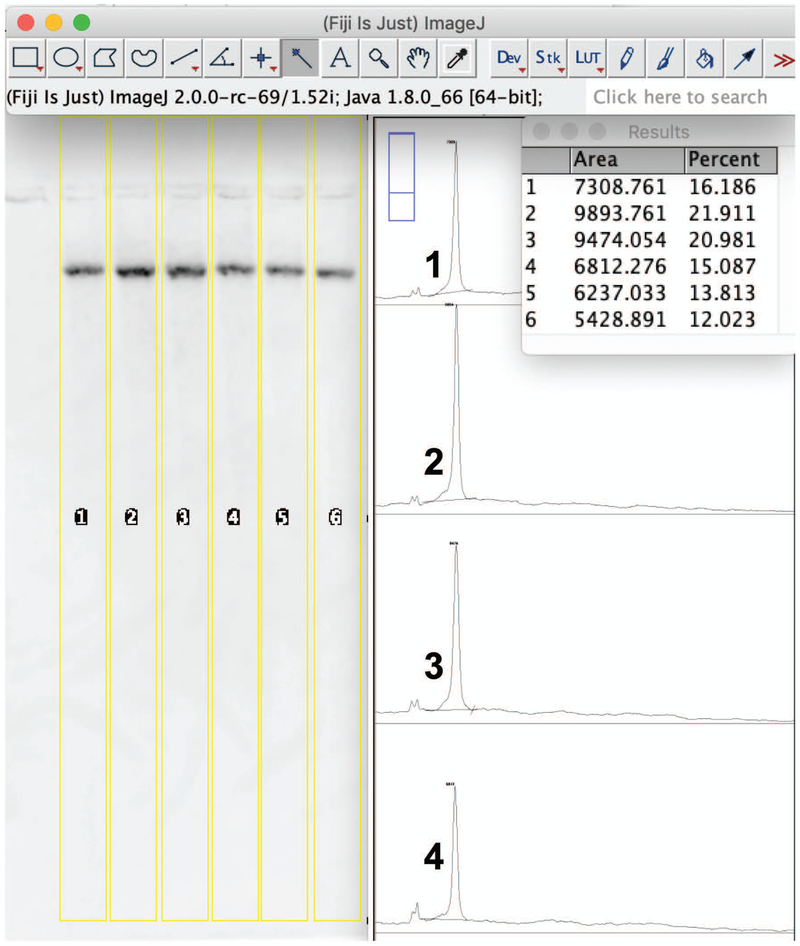
Fig. 4.
Determining relative band areas on a Sothern blot. Fiji image processing for a representative mtDNA blot is shown. Samples were cut with BamHI. The lanes on the blot are selected using the Rectangular Selection Tool, 1 - 6. The closed area plot profiles of lanes 1-4 are shown to the right of the blot. The 'Area' and 'Percent' values are presented in the results window.

