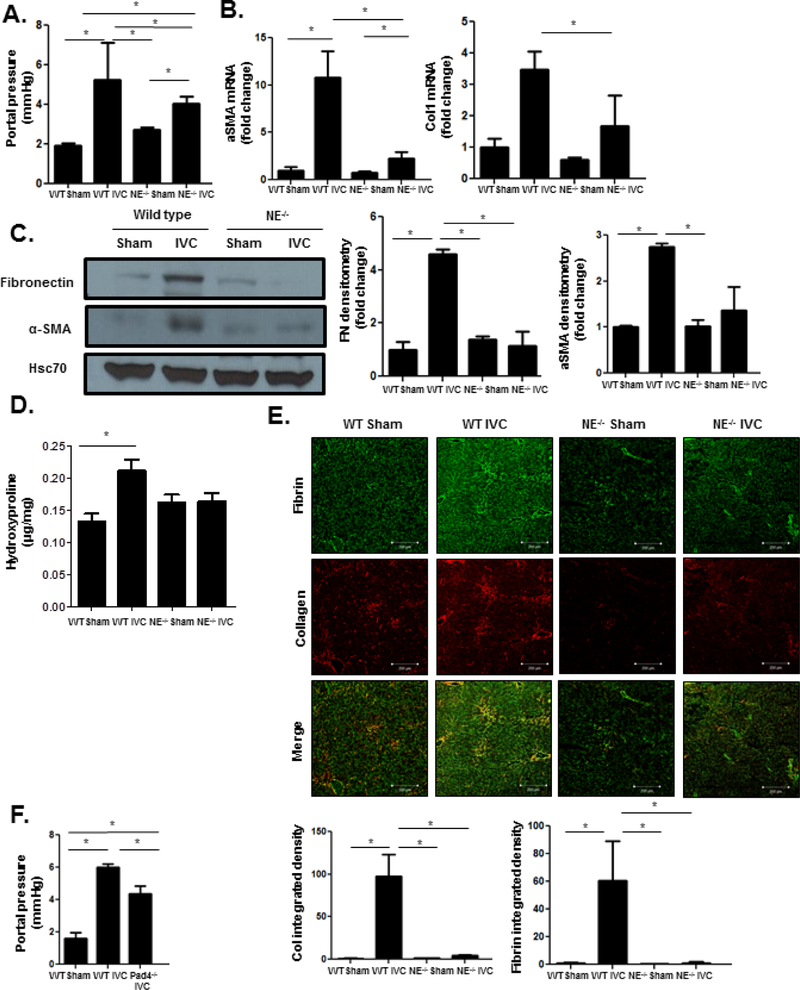
Figure 3. NE−/− mice have attenuated increase in portal pressure and fibrosis after pIVCL.
(A) NE−/− mice have significantly lower portal pressures 6 weeks after pIVCL compared to WT mice (ANOVA P≤0.05). (B) Quantitative reverse transcription polymerase chain reaction from whole liver mRNA shows lower mRNA levels of α-SMA (ANOVA P≤0.05) and collagen 1 (ANOVA P≤0.05) in NE−/− mice after pIVCL compared to WT controls. (C) Western blot analysis reveals decreased fibronectin (ANOVA P≤0.05) and α-SMA (ANOVA P≤0.05) protein levels in whole liver of NE−/− mice after pIVCL compared to WT controls. Hsc70 is a loading control. Quantification is shown in the adjacent panel. (D) Hydroxyproline assay shows lower collagen content in livers of NE−/− mice after pIVCL compared to WT mice (ANOVAP ≤0.05). (E) Collagen (red, ANOVA P≤0.05) and fibrin (green, ANOVA P≤0.05) immunofluorescence was significantly lower in NE−/− mice after pIVCL compared to WT controls. Quantification was performed with ImageJ and displayed in the adjacent graphs (n=5–7; *P≤0.05 for all panels). (F) Pad4−/− mice have significantly lower portal pressures after pIVCL when compared with WT controls (n=4–6; ANOVA P≤0.05).

