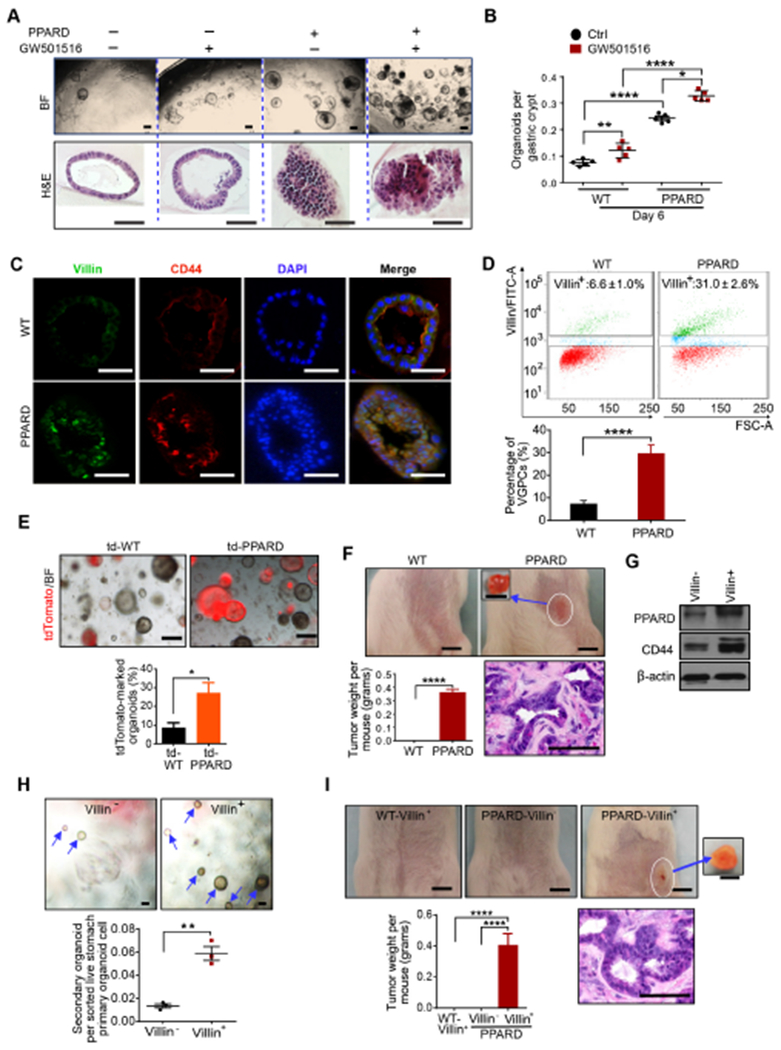
Figure 4. PPARD induced malignant transformation of VGPCs.

(A, B) Representative images (A) and numbers of primary organoids per gastric crypt (B) of PPARD and WT mice with and without GW501516 treatment (n=5 per group). BF indicates bright field light.
(C) Representative villin and CD44 immunostaining images of organoids described in panel A and B.
(D) Villin-positive cells (villin+) sorted by flow cytometry from gastric organoids of PPARD and WT mice.
(E) Representative primary gastric organoid images and precentage of tdTomato-marked gastric organoids at day 10 of culture for gastric organoids that are derived from LSL-tdTomato; villin-cre; PPARD (td–PPARD) mice and their WT LSL-tdTomato; villin-cre (td-WT) littermates (n=3 per group).
(F) Tumor formation by subcutaneous injection of primary gastric organoids, derived from PPARD mice and WT littermates (14 days after injection). Representative tumor images, tumor weights, and H&E-stained sections are shown.
(G-I) Flow cytometry–sorted villin-positive (villin+) and villin-negative (villin−) cells of primary organoids, derived from PPARD mice, were examined for PPARD and CD44 protein expression (G) , and secondary organoid formation (H), and tumor formation by subcutaneous injection of secondary organoid cells derived from sorted villin+ and villin− cells from PPARD mice, and sorted villin+ cells from control WT mice into syngeneic mice was assessed at 14 days after injection (I).
Scale bars, 200 μm (A [top]), 100 μm (A [bottom], C, E, F [bottom], H, and I [bottom]), and 5 mm (top for both F and I).
