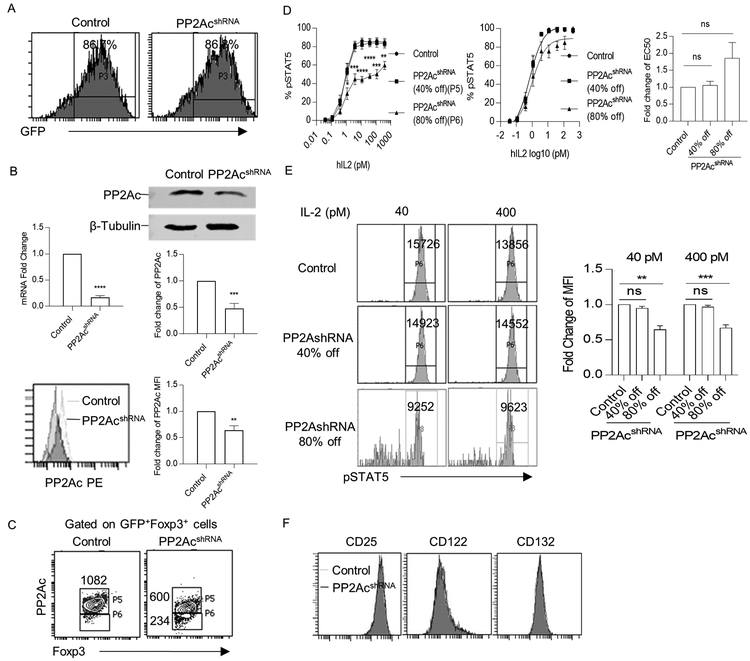
Figure 7:
Knockdown of PP2Ac reduces pSTAT5 response to IL-2 by human Tregs. Expanded human Tregs were lentiviral transduced with control or PP2Ac shRNA and analyzed after 3 days. (A) Transduction efficiency was assessed by the percentage of GFP+ cells. (B) Expression of PP2Ac was assessed by qPCR (n=3), western blotting (n=3), and flow cytometry (n=3) in control and PP2Ac knockdown Tregs. (C) FACS gating strategy for pSTAT5 activation analysis. Tregs transduced with PP2Ac shRNA were gated into two groups according to the knockdown efficiency. Numbers represent MFI of PP2Ac for the indicated cell population. (D) IL-2-induced pSTAT5 dose-response curves (left) for the indicated group of Tregs shown in Fig. 7C (n=6). Nonlinear regression analysis of the binding data (middle) was used to determine EC50 (right) (E) Representative histograms (left) and quantitative evaluation (right) of pSTAT5 MFI for indicated cell population after treatment with 40 and 400 pM of IL-2 (n=6). The numbers represent MFI of the gated pSTAT5+ cells. (F) Representative histograms of IL-2R subunit expression on control and PP2Ac shRNA transduced Tregs. Data (B-E) are shown as means ± SEM and were analyzed by a one-sample two-tailed t test (B, D-E) or an unpaired two-tailed t test (D).*P < 0.05, **P < 0.01, ***P<0.001, ****P<0.0001, ns, not significant;

