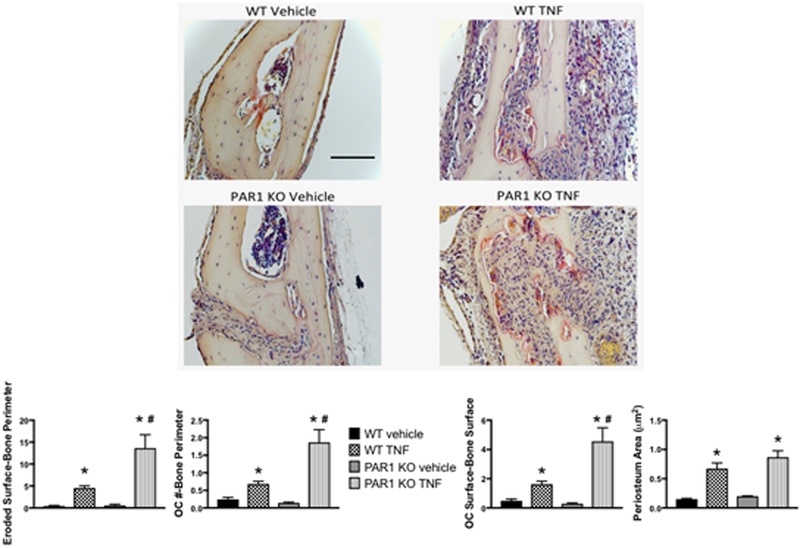
Figure 6.
WT or PAR1 KO male mice were injected once daily with either vehicle or TNF (2 μg) subcutaneously over the calvariae for 4 days and sacrificed 1 day later. Images are representative histology slides stained for TRAP. The graphs below the images show the ratio of eroded surfaces-bone perimeter, OC number (#)-bone perimeter, OC surface-bone surface and periosteum area (μm2). N = 6 – 9 per group. * Significantly different from respective vehicle-treated group, p < 0.01. # Significantly different from WT vehicle-treated group, p < 0.01. Scale bar = 100 μm. All images are the same magnification.

