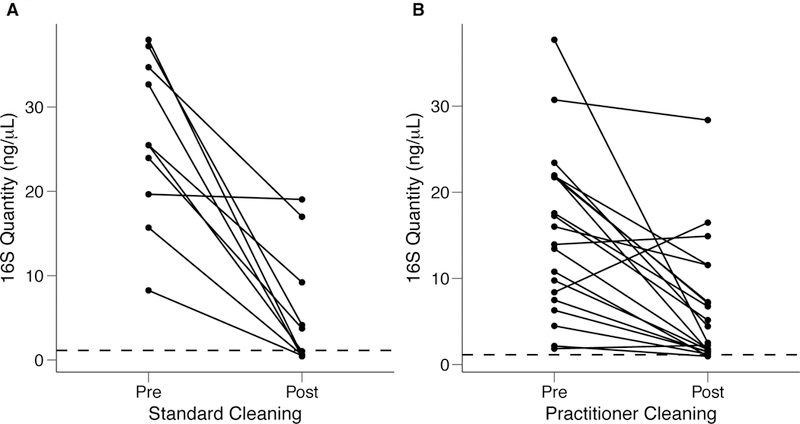
Figure 4: Quantification of bacterial contamination on practitioner stethoscopes before and after cleaning.

Bacterial contamination of practitioner stethoscopes was quantified based on amount of amplicon following barcoded PCR amplification. Cleaning was done using a standardized (A) or practitioner-preferred method (B). The dashed line indicates the mean bacterial quantification measured on the clean stethoscopes. Both cleaning methods resulted in a significant reduction in bacterial contamination regardless of cleaning method (A: p = 5.69×10⁻⁵; B: p = 0.00174; Student’s t-test). In the standardized cleaning group, 5/10 stethoscope fell below the level of the clean stethoscopes as determined by amplicon concentration. In the practitioner-preferred cleaning group, 2/10 stethoscopes fell below the level of clean stethoscopes.
