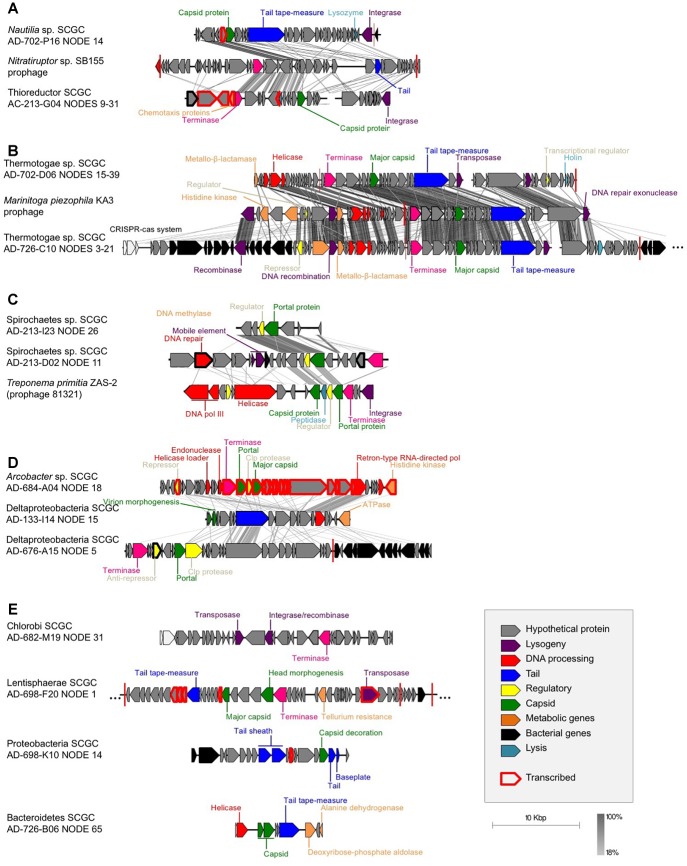
FIGURE 1.
Gene synteny between the identified SAG prophages and their closest relatives from cultured isolates: (A) Campylobacteria, (B) Thermotogae (M. piezophila KA3, accession # NC_016751, positions 301,979-343,554), (C) Spirochaetes (T. primitia ZAS-2, accession # NC_015578, positions 2,202,498-2,225,178), (D) retron-like prophages, and (E) prophages with no synteny with previously sequenced phages. tBLASTx was used to identify homologous regions. Each arrow represents a gene, with black arrows representing bacterial genes, showing the putative site of integration. Red vertical bars represent tRNA genes. Gray scale legend indicates DNA sequence identity between genomic sequences. Genes in red bold were found in the metatranscriptomes, which demonstrates their expression in the environment.

