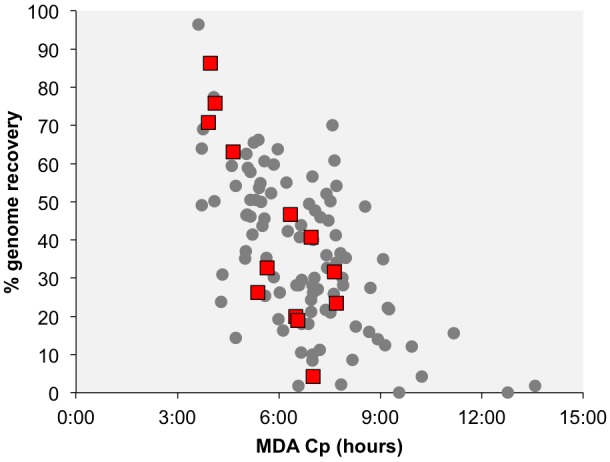
FIGURE 2.

Correlation between the multiple displacement amplification (MDA) critical point (Cp) and the estimated genome recovery. Each data point represents a SAG, with the red squares indicating SAGs that contain phage-like sequences. The Cp is the time required to reach half of the maximal fluorescence of DNA labeled with SYTO-9 stain during single cell MDA reactions.
