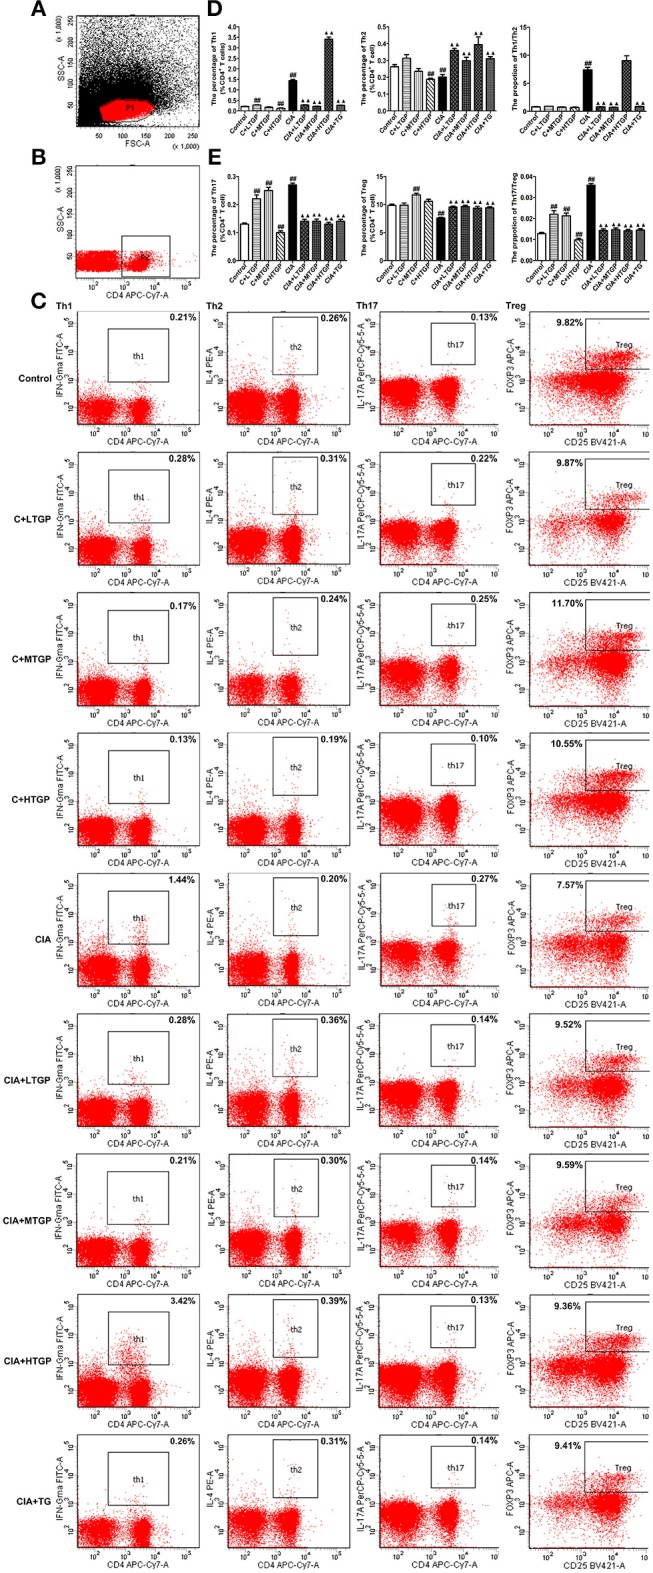
Figure 7.

Effect of TGP on T cell subsets in peripheral blood mononuclear cells of CIA rats. (A) Lymphocytes. FSC/SSC were gated. (B) CD4+ T lymphocytes. SSC/CD4 were gated. (C) Intracellular expressions of IFN-γ, IL-4, IL-17A, Foxp3 on CD3+ CD4+ T cells were gated. (D) Percentages of Th1, Th2 cells and Th1/Th2 ratio were analyzed. (E) Percentages of Th17 and Treg cells and Th17/Treg ratio were analyzed. Control is the normal control group treated with just normal saline. C+LTGP, C+MTGP and C+HTGP are the control groups treated with 158, 474, and 948 mg/kg TGP, respectively. CIA is the collagen-induced arthritis group treated with just normal saline. CIA+ LTGP, C+MTGP, and C+HTGP are the collagen-induced arthritis groups treated with 158, 474, and 948 mg/kg TGP, respectively. CIA+TG is the collagen-induced arthritis group treated with 7.89 mg/kg TG. Data indicate mean ± SEM. ##P <0.01, #P <0.05 vs. Control; ▴▴ P <0.01, ▴ P <0.05 vs. CIA, indicating significant differences.
