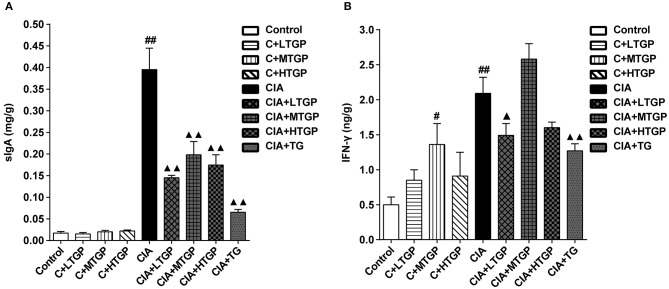
Figure 8.
Effect of TGP on intestinal cytokines of CIA rats. (A) The levels of SIgA in contents of small intestine was estimated by ELISA. (B) The levels of IFN-γ in small intestine tissue was estimated by ELISA. Control is the normal control group treated with just normal saline. C+LTGP, C+MTGP, and C+HTGP are the control groups treated with 158, 474, and 948 mg/kg TGP, respectively. CIA is the collagen-induced arthritis group treated with just normal saline. CIA+LTGP, C+MTGP, and C+HTGP are the collagen-induced arthritis groups treated with 158, 474, and 948 mg/kg TGP, respectively. CIA+TG is the collagen-induced arthritis group treated with 7.89 mg/kg TG. Data indicate mean ± SEM. ##P <0.01, #P <0.05 vs. Control; ▴▴ P <0.01, ▴P <0.05 vs. CIA, indicating significant differences.

