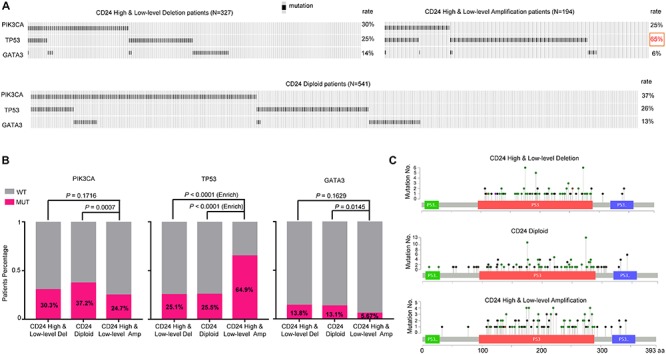
FIGURE 4.

TP53 mutation is selectively enriched in CD24 amplification samples. (A) cBioPortal OncoPrint plot showing the distribution of PIK3CA, TP53 and GATA3 mutation rate in the TCGA BRCA dataset. (B) Bar graphs showing the percentage of TCGA BRCA samples with mutations in PIK3CA, TP53, and GATA3 by different CD24 copy number groups. (C) cBioPortal Lollipop plot showing the loci distribution of mutations in TP53 across TCGA BRCA samples.
