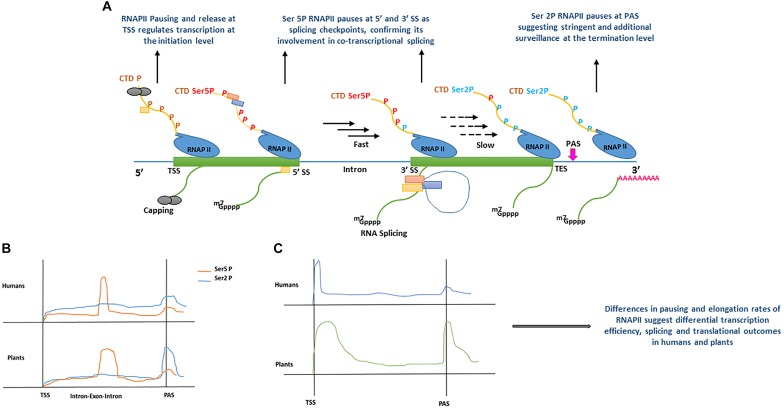
FIGURE 2.
(A) Model displaying the role of RNA polymerase II (RNAPII) C-terminal domain (CTD) phosphorylation during co-transcriptional splicing regulation in human (Nojima et al., 2015), and plants (Zhu et al., 2018). During transcription initiation, the serine residues of RNAPII heptad repeat (yellow line) remain un-phosphorylated (brown ‘P’) around transcription start site (TSS) allowing core spliceosome recruitment (yellow rectangle) and capping (gray circles). During the elongation stage, serine 5 residues of RNAPII heptad repeat (red Ser5P) are phosphorylated around the 5′ splice sites (5′ SS) allowing the recruitment of additional components of the spliceosome machinery (orange and blue rectangles) and enhance RNAPII speed (black arrows). RNAPII elongation slows down (black dotted arrows) promotionally with the decrease of Ser5 phosphorylation toward the 3′ splice site (3′SS). Toward the transcription end site (TES), phosphorylation of serine 2 residues increase significantly resulting in RNAPII pausing before mRNA release (green line). m7GPPP and pink ‘repeated A’ represent 5′ cap and poly A tail, respectively. (B) Comparison of RNAPII CTD serine 2 and 5 residues phosphorylation levels accumulation between human (Nojima et al., 2015) and plants (Zhu et al., 2018). In human and plants, both serine 5 and serine 2 phosphorylation show significant increase after the transcription start site (TSS), only Ser 5P displays a sharp peak at exon–intron boundaries. For instance, a sharp peak of Ser2 P is only shown at polyadenylation site (PAS) in plants, whereas it remains less prominent in humans. (C) Comparison of RNAPII accumulation between humans and plants based on GRO-Seq experiments (Hetzel et al., 2016). In humans and plants, RNAPII occupancy is lower during the elongation stage and marginally increases around PAS. In contrast, plants show a broad peak after TSS, as compared with humans, and a more pronounced increase at PAS, suggesting a surveillance mechanism before a transcript is released. All Graphs are modified from published data to depict peaks.

