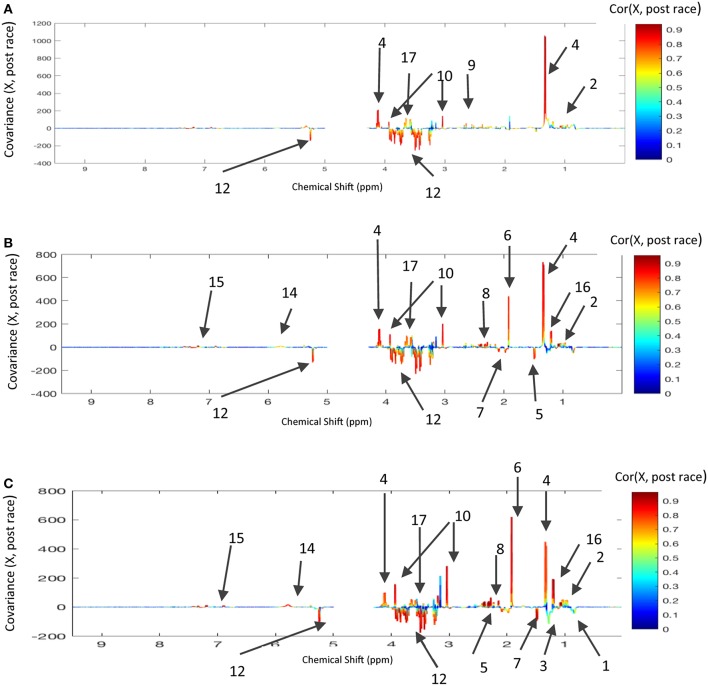
Figure 4.
Loading plots for the score plots' predictive axis (not shown) in O-PLS models calculated for pre-race and post-race samples and the three race distances: (A) 90 km and 16 horses, three components; R2Y = 0.993, Q2Y = 0.874; (B) 120 km and 15 horses, three components, R2Y = 0.986, Q2Y = 0.947, (C) 160 km and 9 horses, three components, R2Y = 0.995, Q2Y = 0.839. The metabolite correlations are represented on a color scale. Positive signals correspond to metabolites present at increased levels in post-race samples. Conversely, negative signals correspond to metabolites present at increased levels in post-race samples. The bins are labeled according to the metabolite assignments in Figure 1.

