FIGURE 7.

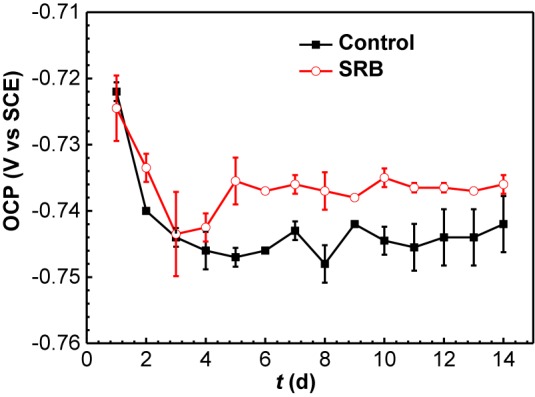
Changes of OCP values with time in the absence and presence of SRB in CO2-saturated simulated formation water. (Error bars represent standard deviations).

Changes of OCP values with time in the absence and presence of SRB in CO2-saturated simulated formation water. (Error bars represent standard deviations).